Ever wonder if a few simple numbers could unlock the secrets of crypto prices? Crypto technical analysis looks at past price trends, like the steady beat of market activity, to give traders clear hints about when to buy or sell. By checking how the candlestick patterns tell their own little stories and noticing sudden shifts in trading volume, you can spot early signs that the market is about to change. Studies even suggest that catching these signals early might help boost your profits. This guide walks you through easy ways to read crypto charts and understand trends, so you can make smart, data-driven choices and truly level up your crypto game.
Core Methods of Cryptocurrency Technical Analysis
Cryptocurrency technical analysis is a way to use math and simple stats to look at past prices and trading volumes. It helps traders spot trends and even guess where prices might go next. You might find it interesting that one study showed traders spotting shifts before major rallies – it’s proof that numbers can really guide predictions.
In digital asset markets, technical analysis means breaking down price changes over time with a data-driven approach. This helps traders get a feel for market mood and understand the trends behind crypto prices. And it’s not just a one-time check – you keep updating the data to catch when the market is about to change. For example, a sudden jump in trading volume can be a clear hint that the price might turn soon.
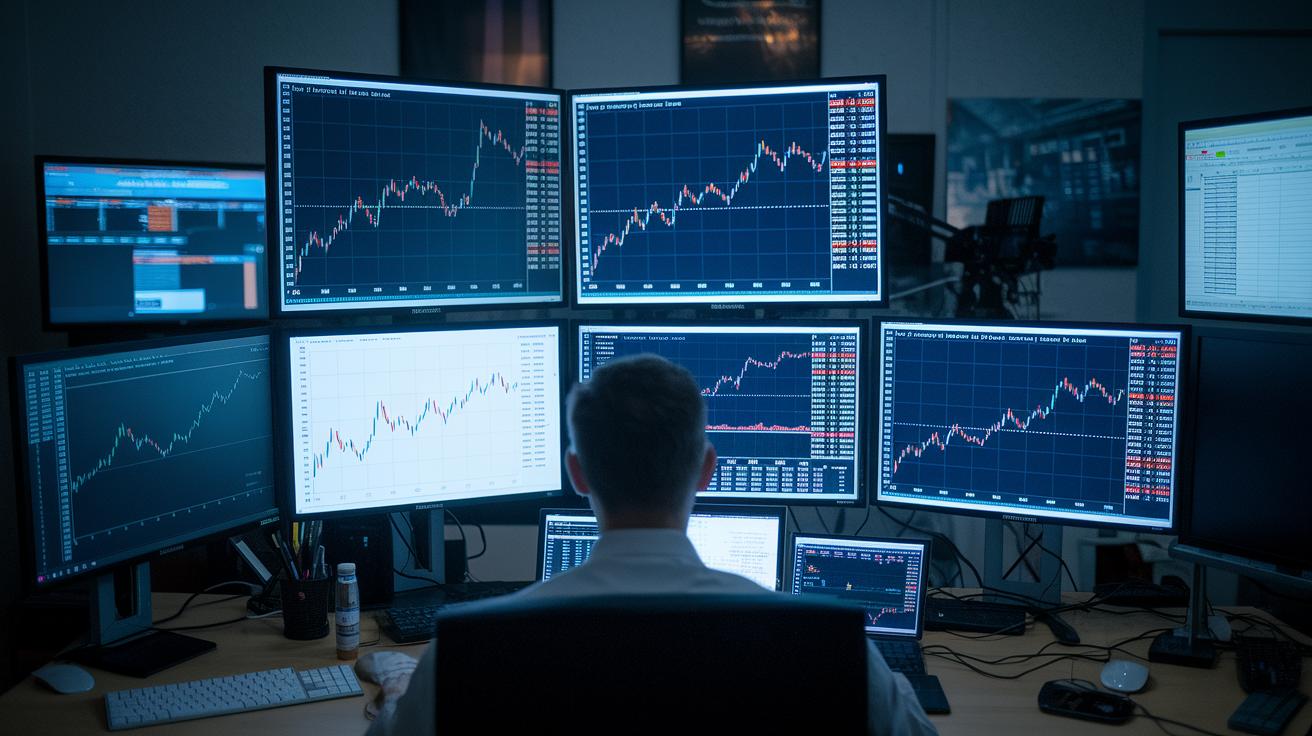
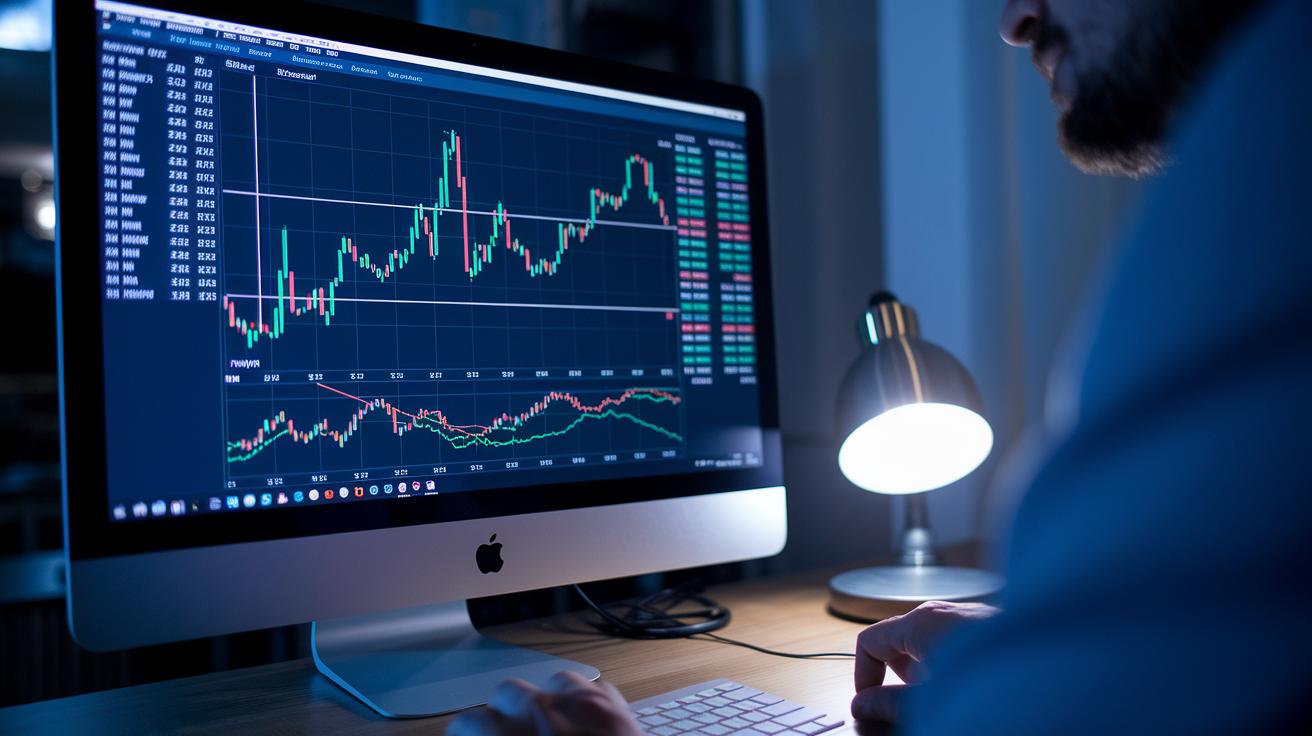
At the heart of this analysis are a few basic chart types: candlestick, bar, and line charts. Think of a candlestick chart as a visual story: each candle shows the starting price, the highest and lowest points during the interval, and the closing price. Imagine each candle telling its own little tale – a trader's entry, some mid-session excitement, a quick moment of worry during a dip, and the eventual calm exit. These charts make it easier to spot patterns and trends, so you can make choices based on clear signals rather than just emotions.
Cryptocurrency Technical Analysis Indicators and Chart Patterns
When you're diving into crypto trading, having the right tools is like holding a map that shows where prices might twist and turn. Traders rely on clear signals that break down the market into bits of sentiment, momentum, and strength, so they can make smart, timely calls.
Here are some key helpers along the way:
- Support and Resistance Levels: Think of these as the zones where prices have bounced in the past. They hint at where money might come in and push the price back.
- Candlestick Charts: These show four basics, open, high, low, and close values, for each period. It’s like reading a mini story of each price move.
- ADX Indicator: This tells you how strong a trend is. When the ADX is above 25, that's a sign the market’s moving with real force.
- Relative Strength Index (RSI): Moving from 0 to 100 with a middle point of 50, the RSI helps spot if the market is too heated (overbought) or too chilly (oversold).
- On-Balance Volume (OBV): By adding up the trading volume when prices rise or fall, OBV gives a peek at the mood of the market.
- Awesome Oscillator (AO): This tool compares fast and slow averages to catch early hints of a shift in momentum.
- Fibonacci Retracement Levels: Using ratios based on past prices, these levels point to key spots where the price might reverse direction.
- Price Consolidation Patterns: These show quiet periods when prices stick close together, suggesting that a big move might be building up.
- Trend Lines: Simple but powerful, these lines on a chart help you see the overall direction, up or down.
- Pivot Points: Based on earlier trading data, pivot points can help predict the next moves, marking critical levels along the way.
Mixing a few of these methods together can really sharpen your trading signals. When several tools agree on a trend or reversal, it gives you extra confidence to take that step forward.
Moving Averages and Momentum Oscillators in Cryptocurrency Technical Analysis
Moving averages work like a gentle smoothing tool for price data. They take past prices and average them to highlight trends. For example, the Simple Moving Average (SMA) just calculates a straightforward average over a set period, while the Exponential Moving Average (EMA) gives more weight to recent prices. There's also the Weighted Moving Average (WMA), which focuses on particular price points to reduce lag in trend detection. Each new price updates these averages, and seeing a 50-day EMA cross a 200-day EMA can be a subtle hint that a trend might be changing.
Then there are momentum oscillators that add another useful layer. They show the force behind price moves, helping to spot subtle shifts, even in choppy markets. Tools like the Awesome Oscillator compare fast and slow averages to measure shifts, and the Average Directional Index (ADX) cuts through the noise by showing how strong a trend really is. Together with moving averages, these oscillators can boost your confidence in spotting trends and making smarter trades.
| Type | Calculation | Typical Use |
|---|---|---|
| SMA | Simply averages prices over a set period | Smoothing out short-term price swings |
| EMA | Gives extra weight to recent prices | Quickly spotting fast-moving trends |
| WMA | Emphasizes key price points with weighted averages | Cutting down on lag in trend spotting |
Volume Analysis Techniques and Support & Resistance in Cryptocurrency Technical Analysis
Volume and support/resistance ideas are like signposts for crypto trading. When you combine them, you can really spot when a price might take off. Traders often see volume surges as hints, little spikes in trading activity, before a breakout happens. At the same time, drawing lines at past highs and lows, or using simple guides like Fibonacci (a method to find key price levels), can show where prices might reverse. This mix of clues helps traders catch trends early and avoid getting tricked by fake moves.
- Compare current trading volume to the usual amount to spot big spikes before major price shifts.
- Draw support and resistance lines using past high and low levels to mark potential turnaround spots.
- Apply simple Fibonacci ratios from earlier price data to add extra levels for guidance.
- Look at both the volume shifts and price movements together to check if a breakout is strong.
- Watch for patterns like triangles or flags, which can hint at where prices might head next.
By mixing volume clues with solid support/resistance marks, you can get a clearer feel for market mood and feel more confident when you trade.
Charting Software and Platforms for Cryptocurrency Technical Analysis
A solid charting platform can truly change how you approach trading. In today’s fast-paced market, having real-time crypto charts and interactive features can help you read trends and grab profitable moments. Let’s dive into a few standout platforms designed for crypto traders.
-
TradingView: This platform gives you real-time candlestick, bar, and line charts so you can see market moves clearly. It lets you create and tweak your own indicators using Pine Script, a tool that helps you design custom charts. Plus, its interactive drawing tools make it easy to sketch trend lines, channels, and even Fibonacci levels on live data.
-
CryptoCompare: Here, you get the ability to view charts over different time periods with detailed depth overlays. This means you can see market volumes and various price layers at a glance. It’s a great choice if you like comparing trends over several time frames.
-
Binance: Known for its user-friendly interface, Binance provides charts for many altcoins with real-time updates. The charts mix price action with volume indicators, so you can quickly spot breakout patterns and confirm where the market might be heading.
-
Financial analysis tools: This option pulls together live market data with a range of technical indicators and drawing tools. Whether you’re just getting started or you’re a seasoned trader, it offers a smooth experience.
When you choose your charting tool, think about what matters most to you, accuracy of data, ease of use, real-time updates, and interactive features that match your trading style.
Algorithmic Strategies and Automated Bots in Cryptocurrency Technical Analysis
Bots in cryptocurrency trading use clear trading signals based on numbers and simple models to decide when to buy or sell. They work on rules set ahead of time, so no one needs to watch over every move. These bots quickly scan market changes, react to price shifts, and make trades using signals like RSI (a tool that measures how fast prices move) and moving average crossovers (a way to spot trends). For example, a Coinbase trading bot can use these triggers to decide the best moments to get into or exit a trade, helping to grab profits without the stress of emotion.
- Trend-Following Strategies: Bots watch for trends by looking at moving averages and other signs of a steady market move. They can ride the wave when the market is on the rise or decline.
- Mean Reversion Strategies: These bots notice when prices stray far from their average and then expect them to head back toward normal levels, creating a chance to make money.
- Arbitrage Strategies: Such systems look for differences in prices between different markets or exchanges, which can lead to quick profit chances.
- Market-Making Strategies: Bots routinely place both buy and sell orders. This helps to narrow the gap between prices and adds steady trading activity in bustling markets.
Before you put any bot into live trading, it’s a good idea to test it out using past market data. Backtesting helps fine-tune the settings to make sure the strategy works well, even when the market changes fast.
Risk Management and Trade Execution in Cryptocurrency Technical Analysis
Managing risk in crypto trading can feel a lot like having a good friend point you in the right direction. Tools like the parabolic SAR give clear, visual hints on where the market might be headed. This helps you decide on stop-loss orders (a stop-loss order is simply a pre-set point where you sell to limit losses) so that you can keep potential losses in check when the market shifts unexpectedly. Using stop-loss and take-profit orders not only shields your investment but also sets you up to exit a trade smoothly when the trend changes.
Balancing risk and reward is crucial for doing well over time. Many traders stick to a 2:1 risk/reward ratio; basically, for every dollar you risk, you aim to earn at least two dollars. Plus, by adjusting your position sizes with the help of the Average True Range (ATR), which tells you how much prices are fluctuating, you can limit your losses even during wild market swings. Matching your trade sizes to what the market is doing helps you manage risk better while still keeping an eye on new opportunities.
Having clear, well-thought-out order execution practices ties everything together. Choosing the right type of order and the best placement is key when your technical signals are pointing you in a good direction. Following these steps not only speeds up your decision-making process but also builds a strong, reliable trading system. For more tips on order types and putting them into action, check out how to start crypto trading at this link: https://cipherreview.com?p=2355.
Final Words
In the action, we explored cryptocurrency technical analysis through core methods, key indicators, chart patterns, moving averages, and risk management. We looked at how price charts, volume spikes, and support/resistance can help pinpoint market signals. Tools like TradingView and real-time data platforms round out a smart toolkit for active trading. By weaving together solid technical strategies with secure practices, every reader has a friendly guide to smarter decisions. Here’s to mastering cryptocurrency technical analysis and keeping a clear and steady path forward.
FAQ
Frequently Asked Questions
What does Technical analysis cryptocurrency PDF refer to?
A technical analysis cryptocurrency PDF is a guide that explains crypto trading methods using historical price charts, patterns, and data-driven models. It’s useful for both novices and experienced traders.
What is a Cryptocurrency technical analysis chart?
A Cryptocurrency technical analysis chart visualizes past price movements with candlesticks, bars, or lines to help traders spot trends, patterns, and support or resistance zones in crypto markets.
How does Crypto analysis today work?
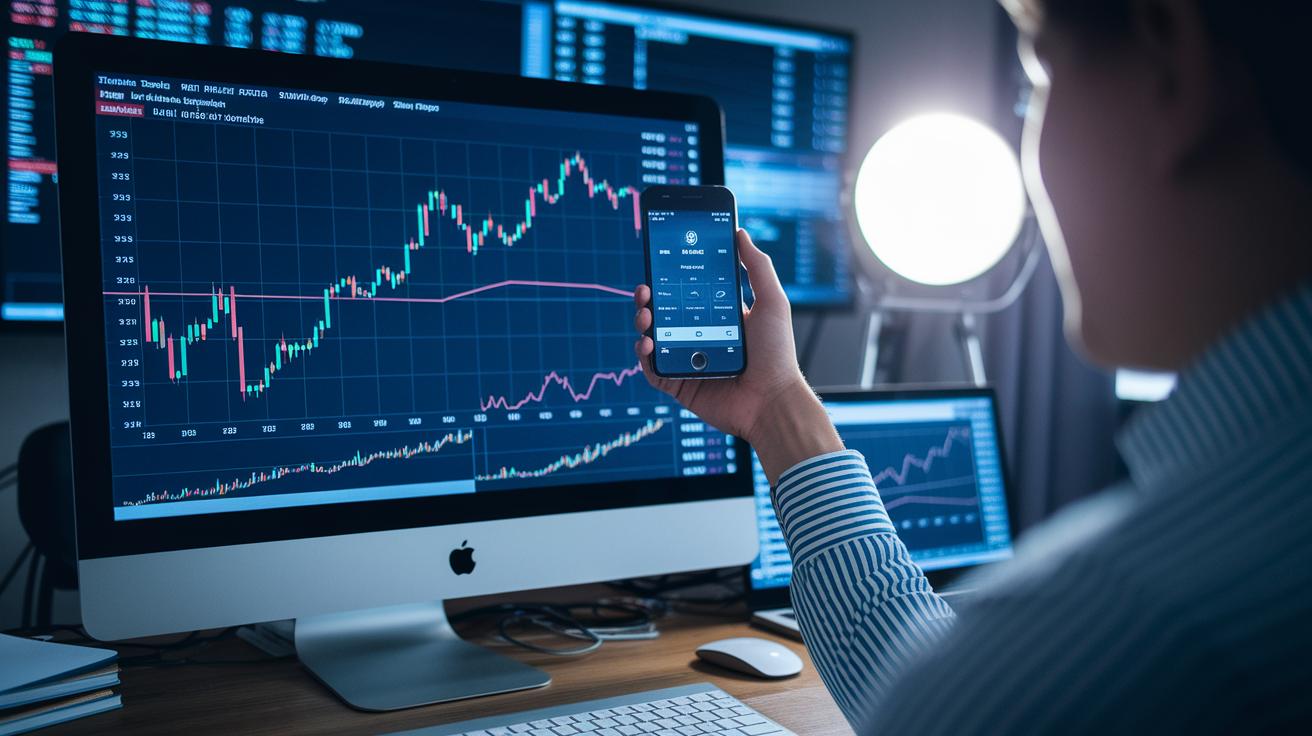
Crypto analysis today uses real-time market data, including price charts, volume spikes, and technical indicators, to identify market momentum and potential entry or exit points for traders.
What is Crypto technical analysis for beginners?
Crypto technical analysis for beginners breaks down complex market data into simple charts and patterns, making it easier to understand trends, price movements, and signals for entering or exiting trades.
What is a Crypto technical analysis website?
A Crypto technical analysis website offers online tools, interactive charts, and educational resources that help users learn and apply chart reading, indicator use, and pattern recognition for smarter trading decisions.
What are the Top 5 indicators for crypto trading?
The Top 5 indicators for crypto trading might include RSI, ADX, OBV, moving averages, and Fibonacci retracement levels, which together assess momentum, trend strength, and potential market reversal points.
Is there a Crypto Technical Analysis course free?
A free Crypto Technical Analysis course offers step-by-step lessons on reading charts, utilizing key indicators, and understanding signals to help users build confidence and improve their trading strategies without upfront costs.
What does a Crypto chart analysis tool provide?
A Crypto chart analysis tool allows traders to load price charts, draw trend lines, and apply indicators like moving averages and RSI, making it easier to spot trends and confirm potential trade signals.
What is the best technical analysis for crypto?
The best technical analysis for crypto combines tools such as candlestick charts, moving averages, and volume studies to provide clear insights into market trends and support informed trading decisions.
Does technical analysis work in crypto?
Technical analysis works in crypto by using historical price data and statistical models to spot patterns and trends, helping traders gauge momentum, though no method can guarantee flawless predictions.
Which crypto will give 1000x returns?
No method, including technical analysis, can reliably predict a crypto that will give 1000x returns. Investment outcomes depend on many market factors and inherent risks.
How can I know when crypto will rise or fall?
You can estimate when crypto might rise or fall by analyzing candlestick charts, volume trends, and indicators like RSI and moving averages, which signal shifts in market momentum.
What is TradingView?
TradingView is a popular charting platform offering real-time crypto charts, drawing tools, and custom indicators to help traders visually analyze market trends and manage risk effectively.
What is Binance used for in crypto trading?
Binance is an exchange that offers crypto trading alongside real-time charts, diverse order types, and a wide range of coins, assisting both beginners and seasoned traders in making informed decisions.
How does Coinmarketcap assist crypto investors?
Coinmarketcap provides essential market data like prices, volumes, and market capitalizations, helping investors gauge overall market trends, track crypto performance, and stay updated on industry shifts.
What role does Coinbase play in crypto analysis?
Coinbase is a user-friendly exchange that simplifies buying and selling crypto while offering basic charting tools, enabling users to understand market movements and execute trades with ease.
What is Bybit known for in crypto trading?
Bybit is known for its derivatives trading features and advanced charting tools, which experienced traders use to apply technical analysis for managing risk and setting up futures trades.
How does eToro incorporate technical analysis?
eToro combines social trading with technical analysis tools. Its platform features interactive charts and trend indicators, allowing users to study market movements and even copy trades from veteran investors.