Have you ever wondered if smart computer programs could beat market trends and help you make money? Think of it like a friendly assistant that looks at old data and uses simple tools to spot changes in the market. It cuts through all the clutter with clear, step-by-step rules so you know exactly when to act.
These days, computers use tried-and-true rules gathered from real market data, turning trading into a process that almost feels natural. In this chat, we'll dive into how mixing trend analysis with computer-led trading can lead to trades that are smarter and more organized. It really shows that having a clear game plan can make all the difference.
Integrating Trend Analysis for Algorithmic Trading Strategy Optimization
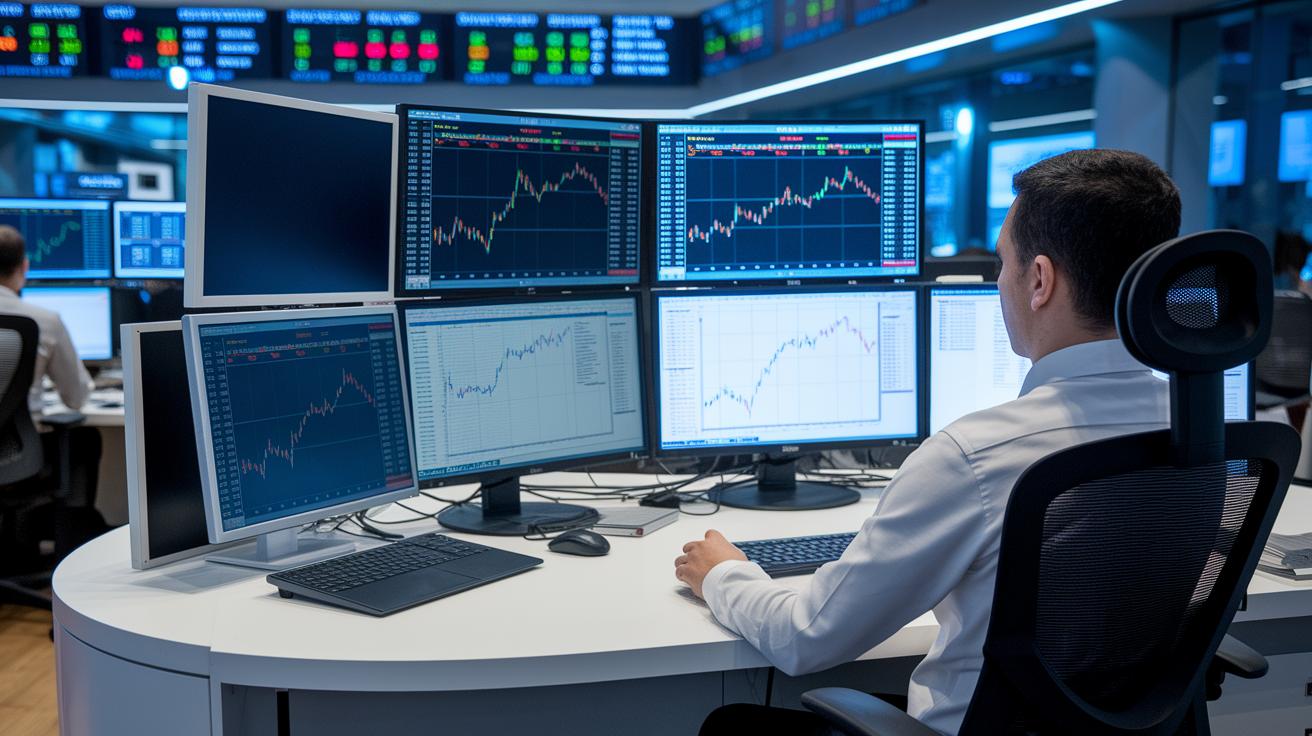
Algorithmic trading often kicks off with trend analysis. This approach relies on rules built from past data, technical indicators (simple tools that show price patterns), and a mix of math models or even machine learning. In plain terms, it’s like having a smart assistant that watches live data to spot shifts in the market. When prices break their usual trends, the system quickly signals a chance for a win.
Trend-following works in a pretty straightforward way. If the market’s on an upward move, traders jump in with long positions (buying stocks expecting them to rise). If things are falling, they might choose short positions (betting prices will drop). This method clears out the background noise and helps set clear entry and exit points, so traders rely less on guesswork.
It’s fascinating to see the impact of these automated systems. Today, machine-driven trades make up about 55% of U.S. equity volume and 80% of foreign-exchange futures volume. And with the global algorithmic trading market set to hit $19 billion by 2024, over 30,000 traders are already using these strategies. In truth, weaving trend analysis into your trading plan offers a structured way to manage risk and seize market opportunities, just like having a trusty guide in the busy market.
Key Trend Analysis Techniques in Algorithmic Trading
Mixing different indicators is the key to today's smart trading systems. We blend basic technical analysis with clever computer learning tools so traders can spot useful signals hidden in the market data. For example, combining tools like moving averages (which smooth out price data to show trends) with strong data processing cuts through the noise to capture trends that older methods might miss. Today, deep learning tools can detect patterns with more precision than the old algorithms. And when we add ways to check price swings (volatility) and watch how different markets move together, traders get a firmer handle on changes in market mood.
Each method gives a fresh view on how the market moves:
- Moving average crossover strategy: This sends clear, long-term signals.
- Momentum oscillator detection: It catches quick shifts in trading moods.
- Volatility clustering assessment: It shows how wild price swings can affect trends.
- Deep learning-based pattern recognition: It finds repeating patterns in huge piles of data.
- Market sentiment analytics via NLP: Natural language processing (NLP) turns loads of text into handy signals.
- Cycle detection algorithms: They track repeating phases in the market.
Each of these approaches paints a different picture of market activity. A moving average strategy gives long-term direction, while momentum oscillators highlight fast changes in the trading scene. Volatility checks tell us how price swings might shake up the market, and deep learning digs into big data to spot familiar patterns. NLP helps sift through heaps of text to find meaningful signals, and cycle detection keeps an eye on recurring market phases. Together, these tools not only fine-tune when to enter or exit trades but also help spread out risk by balancing different strategies. As the market shifts and new sources of data emerge, these integrated methods offer traders practical, data-driven advice that can drive better profit potential.
Leveraging Trend Analysis in Algorithmic Trading Drives Profit
Machine learning is changing the way traders find market signals. It sifts through huge piles of past and real-time data to spot useful clues. These clues help traders make clear, data-based choices instead of relying only on gut feelings. It works a bit like having a busy helper who tracks every little market move, where timing and precision are key.
Deep neural networks work a lot like our brains. They look at layers of data to find even the faintest hints in market patterns that might otherwise go unnoticed. This means traders can catch these early signals and act fast before the trends become common knowledge. Their careful work helps reduce mistakes when market movements happen quickly.
Combining unusual data, such as customer feelings or unique market details, with live price feeds makes trend analysis even stronger. This mix gives a fuller view of market activity, much like seeing a complete puzzle instead of just a few scattered pieces. In doing so, traders gain an edge by building a robust method to forecast future trends.
New technology like quantum computing promises to speed up model training many times over – maybe even up to 100 times faster. Even today, advanced systems in data centers from New Jersey to Chicago work hard to keep delays low. As these tools evolve and mix with current methods, the drive for quick and precise action continues to fuel a profitable and forward-thinking trading approach.
Backtesting Simulation Frameworks for Trend-Based Algorithmic Trading

When testing your trading ideas, it all starts with building a simulation that feels like real market trading. In trend-based trading, this means using carefully gathered historical data and adjusting your settings just right. This way, you get to see how your system would have performed in the past, which helps cut down on surprises when you start trading live.
Keeping your data clean is super important. Even the best set of numbers can lead you astray if it’s too tuned to past patterns. Overfitting happens when your model clings too tightly to old trends, picking up random noise instead of real market signals. To avoid this, traders stick to tried-and-true methods, like those mentioned in the study on technical analysis of stocks and commodities. By double-checking that your indicators work as expected in the simulation, you’re more likely to dodge these pitfalls.
Looking at how your strategy performs boils down to a few key numbers. Tools that track things like the Sharpe Ratio, maximum drawdown, and profit factor give you a clear snapshot of risk and reward. Many experts recommend a full review process that checks every step of your data flow during testing. This thorough approach not only builds a reliable simulation but also helps you fine-tune your strategy to handle the ups and downs of real-life markets.
Risk Management and Performance Metrics in Trend Analysis Algorithms
Risk assessment is key to smart trend analysis in algorithmic trading. When you keep a close eye on risk, you can better manage your portfolio, protect your investments, and adjust quickly when the market changes. By looking at risk-adjusted returns, how well trades are executed, and overall statistical performance, traders get a solid grasp of market moves. Simple measures like the Sharpe Ratio, Maximum Drawdown, Win Rate, Profit Factor, and Average Trade help show where things went well or could use a tweak. These numbers also back up studies on risk and return and help keep automated systems steady, even when the market gets wild.
| Metric | Description | Calculation Method |
|---|---|---|
| Sharpe Ratio | Shows returns adjusted for risk | (Rp – Rf) / σp |
| Maximum Drawdown | Highlights the largest drop from a high point | Peak-to-trough difference |
| Win Rate | Gives the percentage of winning trades | (Winning Trades / Total Trades) × 100 |
| Profit Factor | Measures how much profit you make versus losses | Gross Profits / Gross Losses |
| Average Trade | Calculates the typical gain or loss per trade | Total P&L / Number of Trades |
Using these measures on live trading algorithms gives you a clear, real-time picture of performance. By checking these metrics regularly, traders can make small changes to strategies, keep risk in check, and ensure smooth execution even when the market shifts quickly.
Practical Code Implementation and Deployment of Trend Analysis Strategies

When you’re ready to build a trend-based algorithm, start by setting up your coding space with the right tools. Load libraries like pandas for handling data, NumPy for number crunching, and backtrader for simulating trades. These choices make it easier to design your algorithms, optimize trade orders, and even rebalance your portfolio automatically. With these libraries, you can sort through tons of market data, run tests on past trading days, and adjust your system in real time. Coding in small, separate pieces also means you can keep updating your strategy while checking signals from different market conditions.
Take a look at this simple Python pseudocode to see how you might tackle trend detection, signal alerts, and order execution. The code grabs data, calculates two moving averages (one fast and one slow), and then acts on a market change:
import pandas as pd
import numpy as np
import backtrader as bt

# Load data and set up moving averages
data = pd.read_csv('market_data.csv')
data['MA_fast'] = data['price'].rolling(window=20).mean()  # fast moving average over 20 days
data['MA_slow'] = data['price'].rolling(window=50).mean()  # slow moving average over 50 days

# Create a strategy to check for trend changes and generate trades
class TrendStrategy(bt.Strategy):
    def next(self):
        if self.data.MA_fast[0] > self.data.MA_slow[0] and self.position.size == 0:
            self.buy()  # Buy when the fast average rises above the slow average
        elif self.data.MA_fast[0] < self.data.MA_slow[0] and self.position.size > 0:
            self.sell()  # Sell when the fast average falls below the slow average

# Set up the trading engine and prepare for live orders
cerebro = bt.Cerebro()
# (Here you’d add extra setup to bring in live data and handle real orders)
cerebro.run()
Final Words
In the action, we covered how trend analysis begins with solid fundamentals like technical indicators and refined risk metrics. We explored how machine learning steps in to enhance prediction accuracy while backtesting frameworks help fine-tune strategies. Practical code insights showed you how to implement these techniques in live setups.
Every step builds toward more secure and informed investment decisions. Keep your passion alive and remain curious, knowing that you are always progressing on the path of leveraging trend analysis in algorithmic trading.
FAQ
Q: What is trading algorithms software?
A: Trading algorithms software refers to computer programs that execute trades automatically based on set rules and market data. These tools help reduce manual work and boost trading efficiency.
Q: What are algorithmic trading strategies PDF?
A: Algorithmic trading strategies PDF files are documents detailing systematic methods to execute trades. They offer written guides for setting up automated trading systems using historical and real-time data.
Q: What are the best trading algorithms?
A: The best trading algorithms combine trend analysis with real-time data to generate predictive trading signals. They focus on accuracy, speed, and adaptability to help automate effective trading decisions.
Q: What are examples of trading algorithms?
A: Trading algorithms examples include models like moving average crossovers and momentum oscillators. These systems use technical indicators and preset rules to determine optimal buy and sell points.
Q: What is an algo trading app?
A: An algo trading app is a mobile or desktop application that allows users to implement automated trading strategies. It provides real-time market updates, enabling traders to monitor and manage orders seamlessly.
Q: How does algo trading work on Zerodha?
A: Algo trading on Zerodha involves integrating third-party platforms or APIs that automate trade execution on their system. This setup streamlines order management and leverages market data for timely decisions.
Q: How can algorithmic trading be implemented using Python?
A: Algorithmic trading with Python uses libraries like pandas and NumPy for data analysis and order simulation. Python helps build scripts that analyze trends and automate trades based on algorithmic patterns.
Q: What should I look for in an algo trading course?
A: An algo trading course should cover essential strategy development, coding practices, and real-life trading examples. It provides practical training on building, testing, and deploying automated trading systems.