Ever thought your portfolio tracker might be the secret behind sharper trading moves? Markets can be a whirlwind, and every small change matters. When one smart tool brings all your accounts together, it can really give you an edge.
This guide shows you how portfolio trackers turn a jumble of numbers into clear, easy-to-follow insights. That way, you can spot opportunities quicker and keep risks in check. Ready to see how this simple tool can make your trading more efficient and smart?
How Portfolio Trackers Empower Active Trading
Active traders move fast in busy markets where every second matters. Portfolio trackers bring all your brokerage accounts together into one clear view. This helps you see a full picture of your investments so you can quickly catch the market’s pulse and spot fresh opportunities.
In a lively trading world where things change constantly, it’s important to keep a close watch. You don’t just need to see price shifts, you’ve got to track your daily profit and loss, overall returns, and even fees and dividends. This steady monitoring helps you manage risks and shift strategies in real time.
Here’s what makes these tools stand out:
- Real-time data analytics: Get quick insights into market trends.
- Live market feeds: See up-to-date prices and trading conditions.
- Consolidated account views: Manage several brokerage accounts in one place.
- Automated calculations: Let the software handle fees, dividends, and more.
- Active strategy support: Use built-in features to fine-tune your trading decisions.
By merging all these functions, portfolio trackers turn raw numbers into clear, actionable insights. They let you adjust your positions on the fly, handle market changes without missing a beat, and avoid expensive oversights. Instead of wrestling with many accounts or tedious spreadsheets, you can concentrate on making smart moves. And just think about it, when you have integrated, timely information, even tricky situations can turn into real chances for success.
Key Features of Portfolio Trackers for Active Traders

Imagine starting your day with a simple, clear view of all your investments. A smooth, easy-to-use interface is key for any portfolio tracker. It neatly pulls data from different brokerages and puts it together so you can see your portfolio at a glance. This easy layout shows you important trends and compares your performance with market benchmarks, which means you can spot opportunities or risks fast. Plus, interactive charts let you dive deeper into the details, and customizable widgets let you pick the numbers that matter most to your trading plan.
| Feature | Purpose | User Benefit |
|---|---|---|
| Dashboard Overview | Combines data from several brokerage accounts into one view | Makes it easy to check your overall portfolio health |
| Interactive Charts | Keeps an eye on market trends and your portfolio’s performance | Helps you quickly spot when prices are going up or down |
| Custom Widgets | Lets you pick which data shows up on your dashboard | Builds a view that matches your unique trading style |
| Cross-Platform Sync | Works across desktop and mobile devices | You can check your stats wherever you are |
| Alert Settings | Notifies you of real-time market changes | Helps you act quickly when the market moves |
When all these pieces come together, active traders get a tool that turns complex numbers into simple insights. The friendly interface, hands-on charts, and custom options let you compare your portfolio with the market easily. And with support for both desktop and mobile, you’re never out of the loop. Plus, real-time alerts make sure you’re always ready to make smart moves when things change. Isn't it great when technology makes your trading life smoother?
Portfolio Tracker for Active Traders Explained Shines
Active traders lean on a lively mix of performance measurements to keep their strategies sharp. A well-built portfolio tracker doesn’t just show price changes, it brings together key numbers like return calculations (a way to track your gains) and risk assessments (a simple look at potential downsides) to offer a complete picture in real time. This lets traders look past the number tags and truly understand the strength of their positions.
- Absolute Return: shows how much your investment has grown over time.
- Total Return: combines price increases with dividends, giving you the full gain picture.
- Daily P&L: keeps a daily record of profit or loss.
- Sharpe Ratio: compares your returns to the risk you took.
- VaR (Value at Risk): estimates the possible loss over a certain period at a set confidence level.
- Max Drawdown: highlights the biggest drop from a peak to a low point in your portfolio.
By checking these key numbers, traders can fine-tune their approach. For example, comparing Total Return with Daily P&L might reveal days when fees or taxes have a big impact. Keeping an eye on VaR and Max Drawdown can warn you when your portfolio risk gets too high. This focus helps traders adjust their positions, rebalance their exposures, and get ready to catch emerging market trends.
Advanced Analytical Tools
Beyond the basics, these trackers dive into deeper details. They include tools like correlation analysis, the Sortino Ratio (which looks at downside risk), turnover ratio, and comparisons between actual and expected volatility. This extra layer of insight helps you not only see what happened but also understand why, building confidence for faster, better decision-making in a fast-paced market.
Integration and Automation for Active Trading Portfolio Trackers
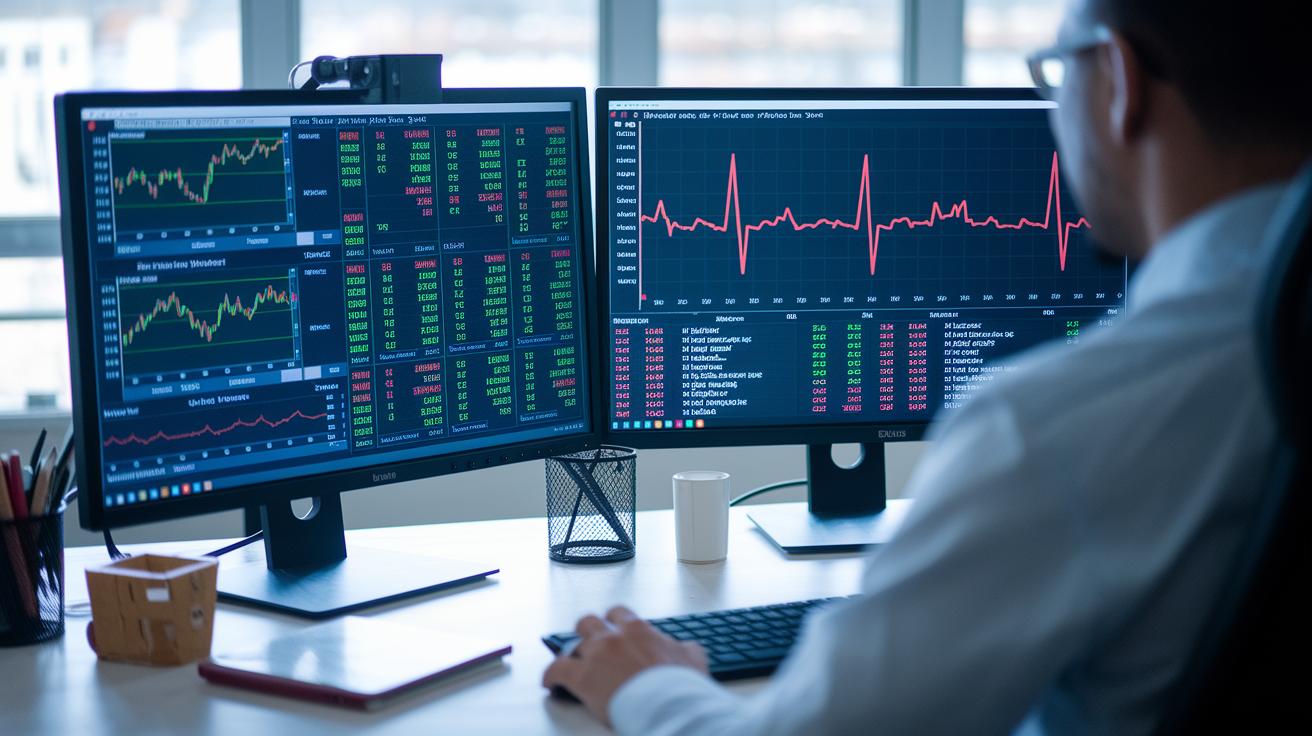
If you’re an active trader, you know how handy it is to cut down on extra work and get clear, real-time updates. Integration and automation pull data from all your broker accounts so you can focus on making fast, smart decisions. Picture your historical data and live feeds coming together like a smooth, steady heartbeat that guides you through the market.
These smart systems use portfolio monitoring APIs to automatically gather data and crunch key numbers. In plain terms, they bring together everything from past trends to live market moves, covering everything from stocks to forex, crypto, and indices. No more clunky manual entry or outdated spreadsheets, you get a neat and efficient way to manage your portfolio.
Ready to set it up? Just follow these three simple steps:
| Step | Description |
|---|---|
| 1 | Link your broker accounts so they work together seamlessly. |
| 2 | Configure endpoints to ensure all your data is properly collected. |
| 3 | Activate continuous updates for live, real-time tracking. |
Once you’ve connected your system following these easy steps, you'll enjoy a smooth experience whether you’re checking your dashboard on a desktop or on your phone. This approach makes it super simple to monitor daily profit and loss, manage risk, and tweak your strategy on the fly. Isn’t it cool how technology can make trading feel almost effortless?
Comparing Portfolio Trackers for Active Traders vs Standard Tools
Standard tracking tools like Excel or simple bank apps mean you have to key in data by hand, and updates often come late. They don't offer live feeds and usually can’t pull multiple accounts together or handle tricky fee changes. On the other hand, active-trader platforms update fees, dividends, and even tax effects automatically. They also let you set up custom filters and alerts so you can follow every market move in real time.
These active tools give you a clear snapshot of your complete trade history and profit/loss figures as they happen. It feels a bit like watching the steady pulse of the market through a crisp lens. And really, who doesn’t crave a tool that cuts down on busy work while making sense of complex details?
| Feature | Standard Tracker | Active-Trading Tracker |
|---|---|---|
| Data Refresh | Needs manual updates; info comes in late | Feeds data automatically and in real time |
| Multi-Broker Support | Usually covers just one account or simple aggregations | Shows data from many brokers and even different currencies |
| Fee & Tax Handling | Basic or manual fixes without adjustments | Automatically adjusts fees, dividends, and tax effects |
| Real-Time Alerts | No live alerts or basic notifications only | Instant alerts when there are key changes in the market |
Switching to an active-trading tracker means you save time and reduce mistakes. With automatic data refresh, linking of several brokers, accurate fee and tax tweaks, and instant notifications, you get a clear and quick view of your trades. This helps you make smoother, faster decisions when the market shifts, letting you monitor your trade history with ease and confidence.
Case Study: Portfolio Tracker in Active Trading Practice
Trader A is an active trader who keeps a close watch on more than 20 different assets using three separate brokerage accounts. They trust a solid portfolio tracker that sends alerts, like when a stop-loss is hit at a 5% drop, helping to avoid sudden losses. Plus, by using tools such as correlation matrices, which show how different assets move together, Trader A can balance their sector investments when the market shifts. Over six months, this smart approach helped them beat the S&P 500 by 8%, proving that modern tracking systems can turn raw data into clear, useful insights.
- dynamic asset overview: Quickly check out all your assets in one clear view.
- instant notifications: Get immediate alerts for market moves and key triggers.
- custom alert features: Set personalized stop-loss alerts and other risk controls tailored to you.
- interactive charting features: Dive into charts that break down trends so they’re easy to follow.
Using these tools, Trader A has built a toolkit that makes managing a complex portfolio feel simpler. The dynamic asset overview gives a big-picture look at everything, while instant notifications ensure every market move gets noticed. Custom alert features let them set precise controls, and interactive charting turns market trends into visual stories. This combination not only speeds up decision-making in a busy market but also strengthens risk management, helping the trader perform better than major market benchmarks.
Final Words
In the action, we explored how a portfolio tracker for active traders explained offers real-time insights and a unified view of your investments.
We touched on integration benefits, performance metrics, and risk tools, all designed to support sharper decision-making.
This article showed how these tools simplify complex data into a clear picture.
Embrace these solutions with optimism and make smarter, faster investment decisions every day.
FAQ
What is a portfolio tracker?
A portfolio tracker is a tool that gathers investment data from multiple accounts, providing real-time performance and risk metrics to help you monitor and manage your investments.
What is active trading?
Active trading means regularly buying and selling assets to profit from short-term market moves. It requires continuous monitoring and quick decision-making based on live market data.
How does active trading differ from day trading?
Active trading covers various short-term strategies and may include holding positions over multiple days, while day trading strictly involves buying and selling within one trading day for immediate gains.
What key benefits does a portfolio tracker offer active traders?
A portfolio tracker provides real-time data analytics, live market feeds, consolidated views of multiple accounts, tracking software benefits, and support for active investment strategies to help you make smarter decisions.
What is the 7% rule, the 5% portfolio rule, and the 3 portfolio rule in investing?
These rules are guidelines for managing risk and allocation. They suggest limits on market exposure or investment size, helping maintain diversification. Each rule offers a method to balance risk across your portfolio.
How does Schwab portfolio performance, checkup, and analysis work?
Schwab’s portfolio tools review performance metrics and account health. They pinpoint issues like underperformance, enabling you to adjust positions and manage risk more effectively through systematic checkups and analysis.
What are common risk management strategies for traders?
Traders use risk management by setting stop-loss orders, monitoring volatility, and leveraging real-time risk indicators. These strategies help limit losses and protect your portfolio during market shifts.
What can a free portfolio tracker for active traders offer?
A free tracker provides essential features like real-time updates, basic analytics, and simplified views, helping active traders manage their portfolios without additional cost, though advanced tools may require a subscription.