Have you ever wondered if our eyes can catch market trends better than a speedy computer? Imagine a trader sketching simple lines on a chart while a computer quickly sifts through thousands of numbers in moments.
This article looks at how each method brings its own strengths. Manual analysis adds a personal touch and thoughtful insight, and automated systems deliver fast, round-the-clock checks.
In truth, choosing between them is all about balancing quick responses with a deeper, careful look at the market.
Comparing Manual vs Automated Trend Analysis Sparks Insight
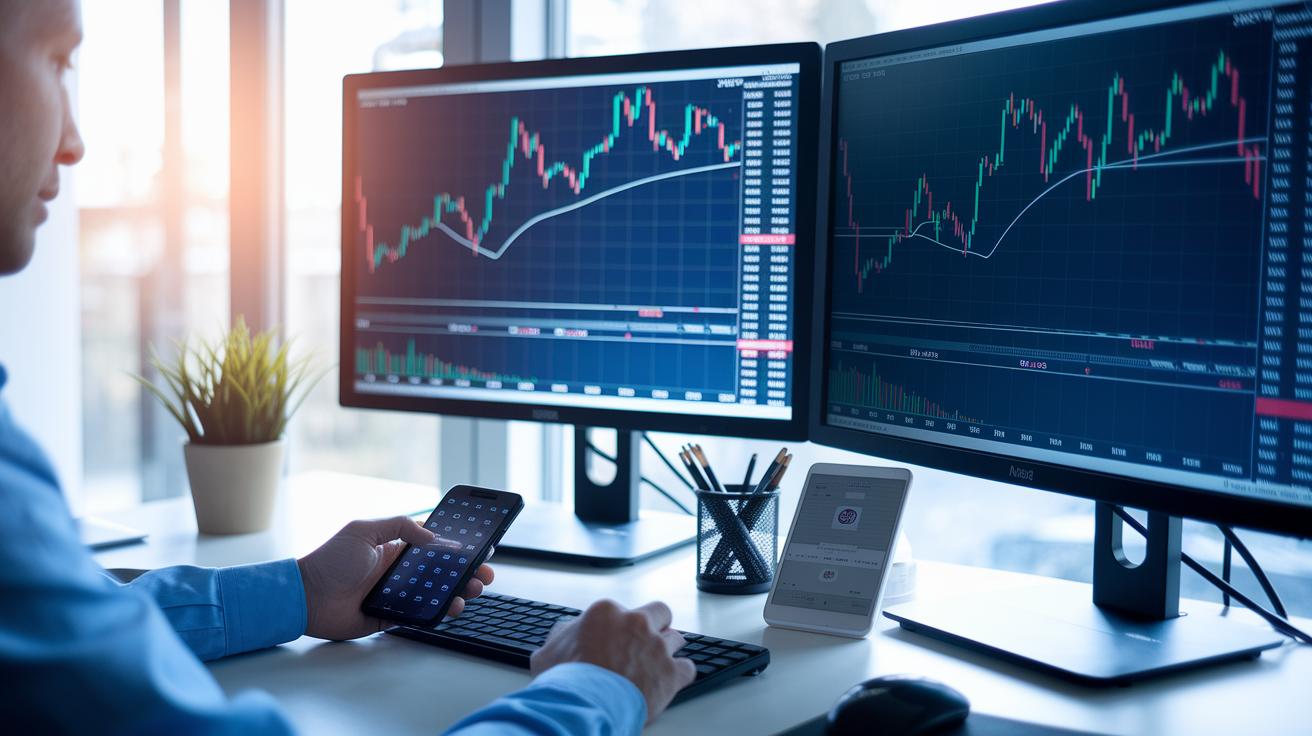
When you think of automated trend analysis, picture a smart tool that sifts through huge amounts of data in just milliseconds. These systems stick to set rules and simple stats to spot patterns without getting swayed by feelings. For example, they might instantly catch a moving average crossover, like watching data points shift direction quickly, almost like a ripple in water. This speed lets you test your trading ideas using past data, making sure your rules work before you go live.
On the flip side, manual trend analysis relies on a person’s judgment and attention to detail. Traders study charts, hand-draw trendlines, and look for familiar setups like head-and-shoulders patterns or channels. It’s a bit like tweaking a camera’s focus until the picture becomes clear. While this method gives you full control and context-specific insights, it’s slower and can be influenced by emotions like excitement or worry.
Both ways have their own strengths. Automated systems offer quick, consistent scanning and can handle multiple markets at once, keeping your cool even when the data flow is intense. Manual analysis, meanwhile, lets seasoned traders play with details that fixed algorithms might miss. In truth, choosing the right method means weighing speed against the thoughtful clarity that only a human can provide.
Understanding Manual Trend Analysis Techniques
Manual trend analysis means you roll up your sleeves and study each chart one by one to see how the market is acting. Traders lean on their gut to draw trendlines, spot support and resistance levels, and notice patterns like head-and-shoulders or channels. For example, you might see a stock bouncing off the same price several times, hinting that this level could act as a barrier when the price shifts.
This method requires you to watch the market closely because things can change in an instant. A trader might say, “Before a big market move, even a few small shifts can set off a series of reactions.” Moments like these highlight that hands-on trend analysis is all about reading live charts and trusting your own judgment.
But it’s not without flaws. Manual trend analysis gives you the advantage of reacting quickly, yet it usually doesn’t involve digging deep into past data like extensive back-testing. Plus, emotions such as sudden excitement or doubt might color your decisions. Essentially, it’s a mix of sharp chart reading and gut instinct, powerful but sometimes a bit unpredictable.
Many traders balance their own observations by using technical tools, like the ones mentioned in
Indicators of Technical Analysis, to back up what they see with clear numbers.
Exploring Automated Trend Analysis Systems
Automated trend analysis systems sift through huge amounts of market data using simple rules like moving average crossovers and statistical limits. Newer systems even use machine learning, which means they can adjust these rules based on how the market changes. You might hear a trader say, "Our system once picked up on small trend changes, predicting market shifts earlier than expected, much like noticing tiny ripples before a wave forms."
Machine learning improves how we catch signals, but it also makes fine-tuning the system a real challenge. It can be tough to adjust settings so the system stays flexible without being too influenced by past data. For example, one system worked great on historical data but lost some accuracy when the market turned volatile. This shows just how difficult it is to balance being sensitive to changes while staying stable.
Case studies bring these challenges into focus. One firm discovered that even though systems with machine learning detected trends early, they sometimes lagged when rare, unexpected moves occurred. For more on historical testing, check out Backtesting Trading.
These insights add a fresh perspective to automated trend analysis, showing how modern technology is combined with the practical challenges of optimizing algorithms for real market conditions.
Evaluating Accuracy and Reliability in Trend Recognition
Technology is changing how we spot trends. New machine learning tools use smart math to pick up patterns quickly. For example, neural networks can mimic many market scenarios almost instantly, cutting down mistakes. Imagine an algorithm that scans millions of data points in a flash, catching details that a person might miss.
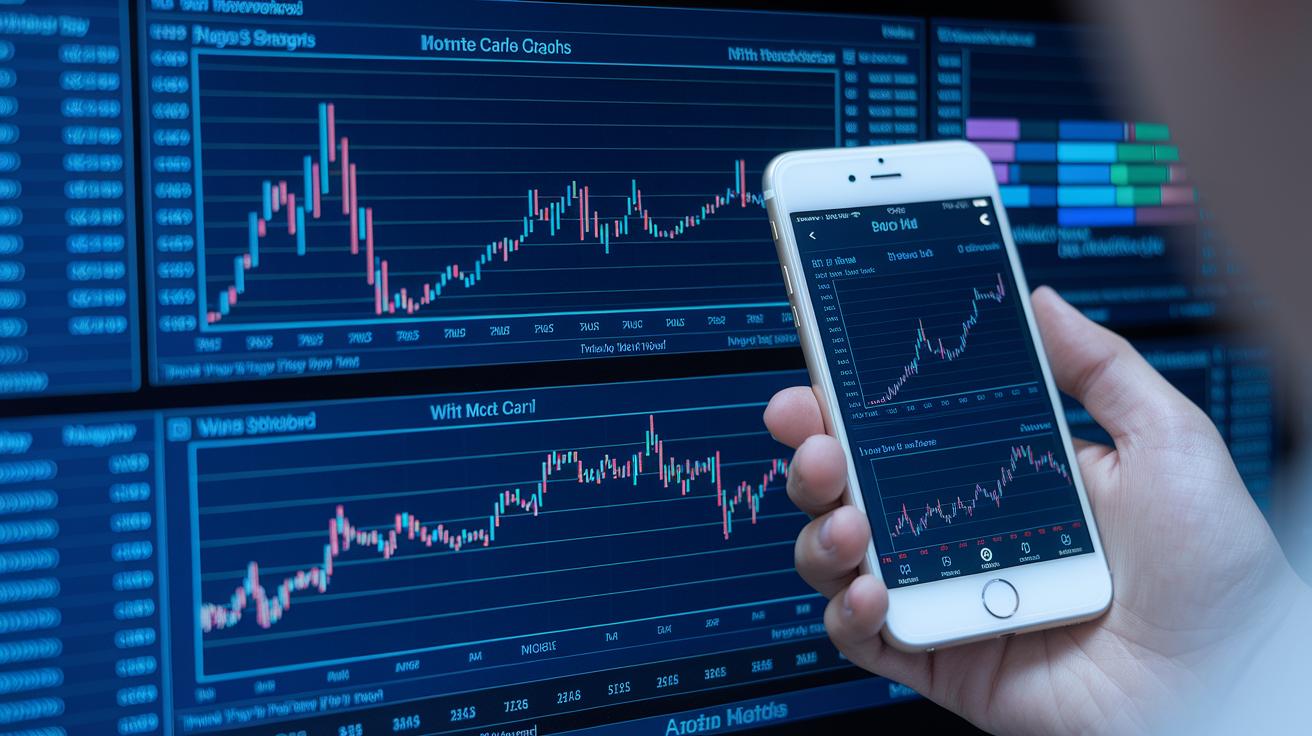
A recent study showcased a system that mixes Monte Carlo simulation with live market data. This method adjusts probability numbers to predict trends more consistently. Picture this: a trading system using Monte Carlo techniques boosted its trend accuracy by 15% compared to older methods.
New methods like Bayesian Inference keep trend forecasts fresh by constantly learning from the latest market info. It’s a bit like fine-tuning a musical instrument to hit the perfect note. This process makes the system more robust and less swayed by random data points. Imagine recalibrating your prediction model in real time to maintain perfect pitch.
All these techniques bring a new way of looking at precision and reliability. They give traders fresh insights to reduce errors and improve overall performance. Isn’t it fascinating how smart strategies can make trading both safer and more effective?
Assessing Efficiency and Scalability in Trend Analysis
Manual trend analysis usually means spending long hours or even days looking at charts. This old-school approach needs your full attention and careful focus, which can make labor costs climb higher. Imagine an analyst spending a whole morning updating trend charts by hand, it's tough to find time for deeper strategy when you're stuck with this repetitive work. Plus, when you're working non-stop, fatigue can sneak in, leading to mistakes that compromise consistency.
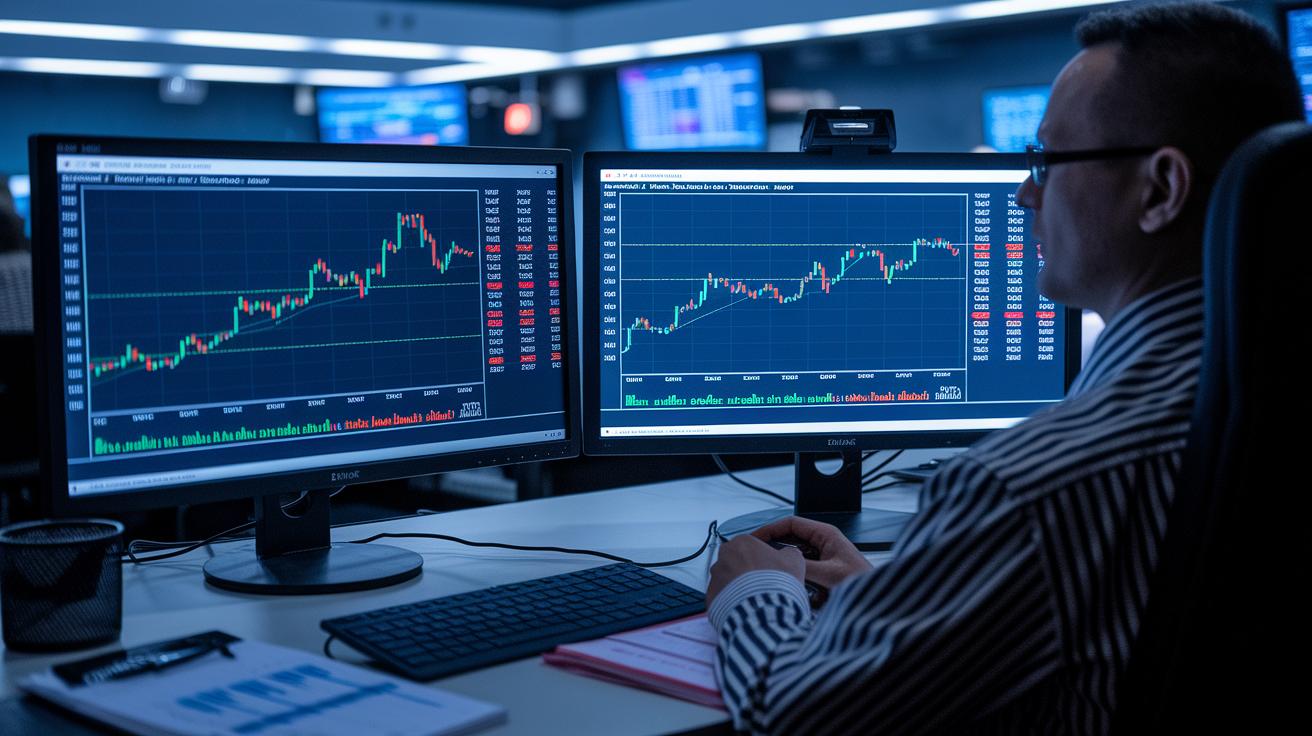
Automated systems, on the other hand, can blaze through massive datasets in minutes or even seconds. They work on rules like moving average thresholds, basically, simple checks that help them keep up with multiple markets at once. Picture this: while your coffee brews, an algorithm can review thousands of data points. This speed not only saves you time but also cuts down on the extra costs that come from scaling up your analysis.
Sure, investing in automation might mean paying for advanced tools at first. But over time, these costs often get balanced out. Your team can focus on high-value tasks instead of tedious data entry, and you'll likely see fewer costly mistakes along the way. The ability to adjust on the fly is a huge bonus when market trends change quickly. Plus, automated systems can grow with your business without needing to add more staff, making them a smart move for better efficiency and cost management.
Here's what you get with automation:
- Lower processing time
- Easier scalability
- Savings over the long run
These benefits make automation a strong partner in boosting both efficiency and scalability in your trend analysis.
Pros and Cons: Human-Centric vs Automated Trend Analysis
Manual analysis relies on a person’s gut feeling to pick up on little market hints that numbers alone might miss. For instance, one trader might say, "I felt a change coming even before the data caught on." This hands-on approach can adapt to surprises, but at times it might lag during fast market moves.
Automated systems, on the other hand, sift through huge amounts of data super fast, imagine finishing thousands of data checks before you sip your coffee. They offer steady, repeatable results, yet they can overlook the nuance and intuition a human brings to the table.
| Aspect | Nuance |
|---|---|
| Manual Analysis |
|
| Automated Analysis |
|
Choosing Between Manual and Automated Trend Analysis
Choosing the best way to track trends starts with a simple plan. First, think about how much data you have, how quickly you need results, the skills you have in-house, and any rules you must follow. Score each of these factors to see which method might suit you best. For example, if your data is small and every detail matters, manual review might give you more depth. But if you’re handling a huge stream of information, automated systems can sift through it fast.
Some firms even mix the two methods. One company, for instance, used automation to pick out 100 potential signals, then had a trader step in to review them one by one. One trader explained, "I filter out noise manually to focus on true market shifts." This blend shows that while technology handles the heavy lifting, human insight remains crucial.
Here’s a simple game plan:
- Write down your key challenges.
- Give each method a score based on cost, speed, and keeping up with regulations.
- Combine approaches by letting automation scan the data, then having a human review the critical points.
| Factor | Manual Advantage | Automated Advantage |
|---|---|---|
| Dataset Size | Offers a closer look at small data | Quickly handles lots of data |
| Expertise | Relies on real human judgment | Follows rules consistently |
| Regulation | Delves into nuances for complex cases | Makes fast calls when rules allow |
This strategy helps you keep your trend analysis aligned with what matters most to your operations.
Final Words
In the action, we explored manual methods that lean on human insight and automated systems that bank on speed and consistency. We broke down key steps, weighing benefits like real-time judgment against algorithmic precision. Comparing manual vs automated trend analysis shows both bring unique strengths to your investing strategy. This balanced look helps you decide what works best for managing risk, tracking market trends, and keeping your finances secure. Keep an eye on the market and trust your judgment as you move forward.
FAQ
Comparing manual vs automated trend analysis pdf
The PDF comparison outlines how manual methods use human insight for trend evaluation while automated systems rely on rules and data processing, showing differences in speed, scalability, and subjective judgment.
Comparing manual vs automated trend analysis examples
The examples illustrate that manual trend analysis relies on expert interpretation of charts, whereas automated analysis employs algorithms for quick, consistent data processing and back-testing across large datasets.
Automated data collection
Automated data collection means using software to gather and process data quickly, reducing human error and boosting the speed needed to detect market trends accurately.
What is the difference between manual and automated analysis?
The difference lies in manual analysis offering human insight and context sensitivity, while automated analysis uses pre-set rules and statistical thresholds to deliver fast, data-driven results.
How do you decide if a test case should be manual or automated?
Deciding on manual versus automated test cases depends on test frequency, complexity, cost-effectiveness, and whether human judgment is necessary for nuanced assessments versus rapid, consistent execution.
What are two advantages of using automated data collection methods over manual methods?
Automated data collection offers faster processing and reduced risk of human error, allowing for efficient handling of large datasets while supporting back-testing capabilities for trend analysis.
When should you prefer manual testing over automation testing?
Manual testing is preferred when complex, context-specific insights are needed, or when the dataset is small and does not justify the upfront investment in automated tools.