
Have you ever felt like investing is just for the pros with expensive tools? Think again. Free stock screeners prove that you can start investing smartly even on a budget. They let you filter important details like price and earnings so you can spot trends in the market without spending a cent. With simple filters, you can see at a glance which stocks fit your plan, whether you're just starting out or fine-tuning your strategy. This free approach gives you a boost while helping you keep up with the market pulse.
Top free stock screeners for comprehensive market analysis
Free stock screeners are super handy for anyone looking to get a quick glimpse into the market without spending extra cash. They help you filter through thousands of stocks using key numbers like price, volume, and earnings in real time. This free approach gives both beginners and seasoned investors a clear look at market trends, making it easier to spot fresh opportunities.
These tools are built for flexibility and ease. You can customize your search to match your personal strategy. Whether you’re keeping an eye on short-term moves or planning for long-term growth, free screeners let you track market activity and fine-tune your approach. Plus, with several platforms available, you’re sure to find one that fits your skill level and analysis needs.
- Fidelity: You can view basic charts and performance data without even signing up, though registering unlocks advanced themes and expert opinions.
- Finviz: This tool offers a wide range of filters, from IPO dates to the number of shares outstanding, and you can save your preferred screen settings with a free account.
- Yahoo Finance: With its clean, intuitive interface, it’s easy to screen for sustainable stocks, mutual funds, ETFs, and futures.
- TradingView: It’s friendly for new users and packed with robust technical data, plus it lets you screen for forex and even cryptocurrencies.
- StockFetcher: Enjoy customization with over 125 technical indicators and a detailed user guide that makes setting up your filters a breeze.
- Stock Analysis: This platform offers practical tooltips to explain complex financial terms, allowing you to save your screeners for free while offering extra data if you upgrade.
In short, free stock screeners give you the
Free trading scanner features and filter options explained
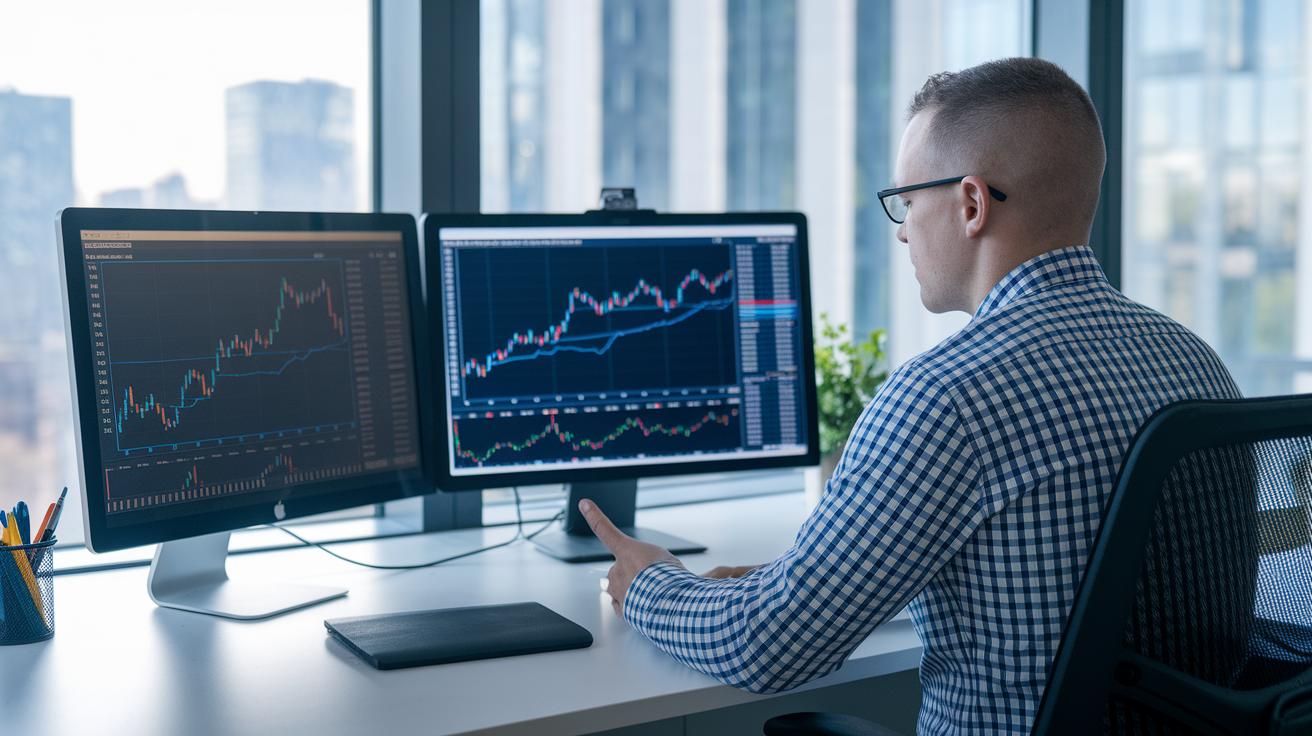
Smart investing starts with filters you can set up just the way you like. They let you choose your own thresholds and mix different numbers to match your unique style. With flexible screening, you dodge cookie-cutter rules and let your filters flow with the market’s rhythm. Categories like stock research data, top dividend stocks, market indexes, precious metals, exchange rates, and interest rates give you a wide-angle view of the market. This way, you can focus on the key numbers without worrying about strict limits.
| Filter Type | Category | Example Metrics | Use Case |
|---|---|---|---|
| Technical Indicators | Chart Trends | Moving Averages, RSI, MACD | Spotting price patterns and trends |
| Fundamental Metrics | Financial Health | Income ratios, Debt ratios, Revenue | Checking a company’s operational strength |
| Performance Metrics | Market Activity | Short-term and long-term returns | Keeping tabs on investment performance |
| Market Data | Macro Trends | Indexes, Precious Metals, Exchange Rates | Grasping wider market influences |
Mixing multiple filters allows you to blend both technical factors and core financial details for a balanced view. For example, pairing moving averages with key financial ratios gives you a focused filter that can cut through the clutter. This strategy not only streamlines your research but also helps spot opportunities that fit what you’re looking for. Curious for more? Dive into technical analysis insights or check out some fundamental analysis tips to expand your understanding of financial performance.
Real-time equity checker free: monitoring live market data at no fee
With our free tool, you can instantly keep an eye on the market without paying a penny. It gives you live updates on categories like Top Gainers, Top Losers, Most Active, After Hours, and even a Market Heatmap. This means you see stocks climbing or falling as soon as it happens. Imagine this: one moment a stock is quiet, and the next, it’s rising fast, all thanks to real-time updates!
The tool refreshes data every few seconds during market hours. It covers over 5,500 stocks so you never miss a beat, no matter how quickly things change. This steady stream of fresh data lets you catch rapid market shifts and focus on the trends that really matter.
If you’re trading intraday or using swing strategies, this live monitoring can be your secret weapon. Seeing up-to-the-minute price changes and market sentiment (how investors feel about the market) can help you make smart, quick decisions. It's like having the pulse of the market right at your fingertips, so you can adjust your strategy on the fly.
Free alert system for stocks: setting up alerts without subscription

Setting up alerts is a smart way to track important market changes without signing up for a costly subscription. It works by delivering quick bullet points on daily market news and helps you keep an eye on things like price jumps, extra trading volume, and significant performance benchmarks.
First, choose the factors that matter the most to your trading game. Next, set clear numbers to tell you when a stock’s price moves up or when trading volume hits a spike. Then, pick how you want to be let in on these updates, maybe via email or on your phone. After that, decide how often you want to check for these updates. Finally, turn on the alert and watch how well it works over time.
Using this kind of alert system lets you catch key market signals right when they happen. It’s almost like having a helper who gives you a nudge whenever something important stirs in the market. This way, you can respond faster and keep your trading strategy lively and on track.
Mobile screening app free: screen stocks on the go
Imagine having access to more than 5,530 stocks right in your pocket. With these mobile screening apps, you get a friendly, simple tool that works much like its desktop counterpart. They offer filters like price, volume, and technical indicators, making it easy for you to spot great opportunities, even when you’re on the move.
Using these apps feels natural. You can save your custom screens without any hassle, which means you can tweak your research anytime. Some of them might ask you to create an account so your settings sync across devices. This way, whether you’re at home or on the road, your personal filters follow you.
Want to keep up with market trends? Look for categories like Top Analysts, Corporate Actions, Recent IPOs, ETF Screener, and IPO Calendar. These features let you track key events and check out new stock entries even when you’re away from your computer. And if your internet isn’t reliable, many apps let you review your saved screens offline.
Comparing no-cost market analyzers: feature-by-feature breakdown

When you're picking a no-cost market analyzer, it helps to look a little deeper than just the basic filters and account needs. Think about how each tool handles quick market changes and what real users say about the interface during busy trading hours.
| Tool | Key Filters | User Level | Account Requirement | Limitation |
|---|---|---|---|---|
| Fidelity | Simple charts and performance data | All investors | No account needed for the basics; signup is required for deeper insights | Less detailed info available without an account |
| Finviz | IPO dates and outstanding shares | Intermediate to advanced | Free account needed to save custom settings | Preset saving isn’t available unless you log in |
| Yahoo Finance | Sustainable stocks, mutual funds, ETFs, futures | Beginners to intermediate | No account required | Advanced charting options are a bit limited |
| TradingView | Forex and crypto screeners, solid technical data | Beginner friendly | An account can boost functionality but isn’t needed to start | Some high-end features only work with registration |
| StockFetcher | More than 125 technical indicators | Advanced users focusing on technical analysis | A free account is needed to save your filters | The interface and data can be a bit much for newbies |
| Stock Analysis | Saved screeners, tooltips for terms, basic financial data | Beginners to intermediate | Allows free saving; a Pro plan ($6.58/month) offers ten-year data | Extended data comes with a monthly fee |
Matching a tool to your own investing style means weighing how these platforms handle sudden market shifts and how users value features like mobile usability or real-time updates. For example, during a fast market move, TradingView’s lively charts offer near real-time updates, a benefit many users swear by for making quick decisions.
Ultimately, combining clear performance details with genuine user experiences can help you pick an analyzer that not only ticks all the boxes on paper but also stands out when the market gets busy.
Free risk analysis tool: assessing stock volatility and performance
Risk metrics help you understand how steady or wild a stock might be. They include numbers like beta, which tells you how much a stock’s price follows the market, and standard deviation that shows how much returns can change over time. You’ll also see figures like debt-to-equity ratios, which hint at how much money a company borrows, plus income ratios and revenue growth filters to give you a clear picture of a company’s overall health.
Using a free risk analysis tool means you can easily sift through stocks based on how much price swing you can handle. Many free scanners let you create custom screens that mix both technical details and basic company data. This way, you can find stocks that not only grow steadily but also keep risk at a level you’re comfortable with, like choosing stocks with a lower beta or a gentle debt-to-equity ratio.
These free tools break down performance by both short-term and long-term results, making them a great starting point for your investment research. While paid options might dig a little deeper with more history and extra details, these free tools still give you the essential insights to make smart choices without any upfront cost.
Step-by-step guide to using a free stock screener effectively
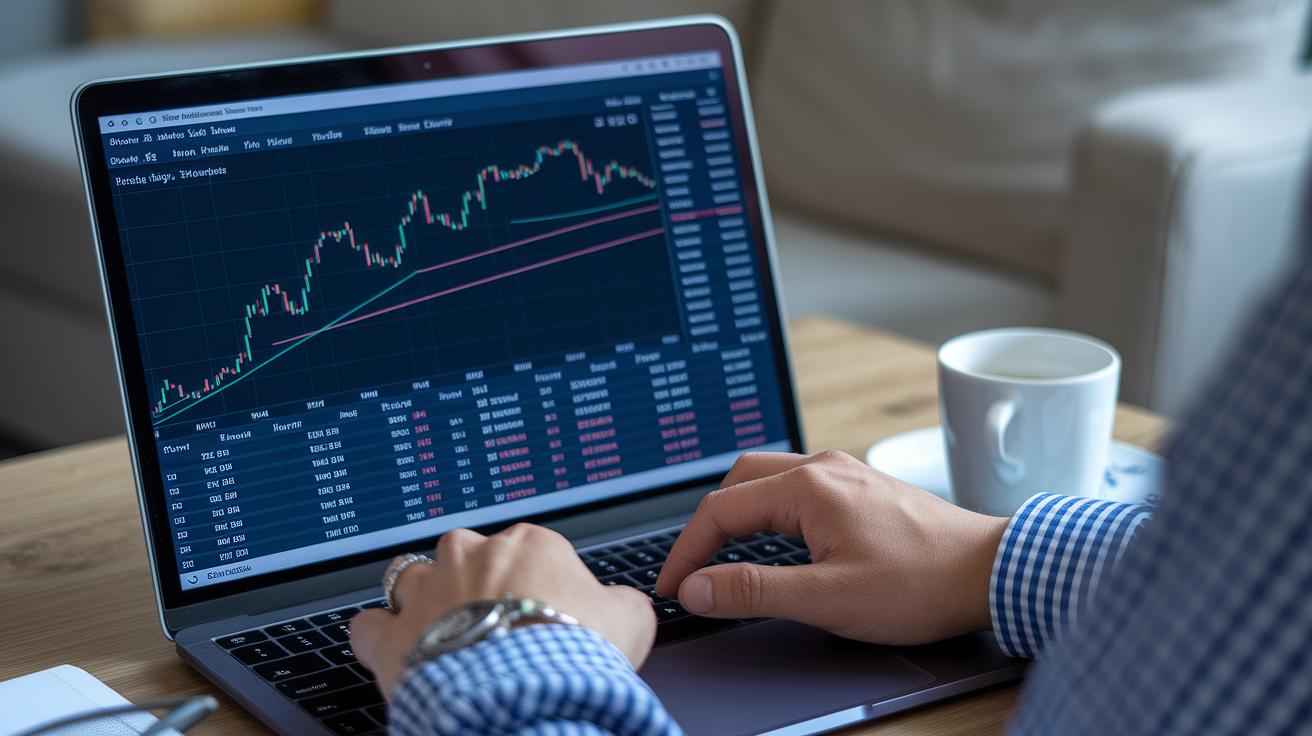
When you open a free stock screener, you can sift through over 5,530 stocks. You get to pick categories like Industry, Sector, Index membership, or ETF lists. This means you set the ranges for price, volume, and ratios that matter most to you.
You can also sort stocks by how they’ve performed in a short time, like over one day or a week, or over longer periods such as six months or a year. Some screeners even let you mix in tools like RSI (a way to see if a stock might be too high or too low) and moving averages (which help spot trends) with basic financial info. It’s an easy, friendly way to tailor your search to your investing needs.
- Pick your universe: Decide which group of stocks you want to look at, such as those in a specific industry or part of an index.
- Set fundamental filters: Choose the main numbers like earnings, debt ratios, or revenue. These help you check how a company is doing financially.
- Add performance metrics: Include filters that show both short-term moves and long-term trends so you can see immediate changes and lasting patterns.
- Include technical indicators: Add tools like moving averages or RSI to help you get a better idea about the right timing and momentum.
- Run the screen: Hit the search button to pull up a list of stocks that match your chosen criteria.
- Review and export results: Look over your findings, adjust your filters if needed, and then save or export the list for more analysis later.
As you get more comfortable, remember that fine-tuning your criteria is key. You might start combining technical data with basic financial insights to better match the market’s ups and downs and your personal investment goals.
Final Words
In the action of exploring free market tools, we reviewed top platforms from Fidelity to Stock Analysis, breaking down key features like customizable technical filters, real-time market updates, and mobile access. We also touched on risk assessment and setting up alert systems, all aimed at empowering secure and effective trading.
Using a stock screener free tool is a smart way to keep your research cost-effective while managing risk. Each option offers unique benefits to help you stay agile and informed. Enjoy the excitement of making smart trade decisions!
FAQ
Stock screener free online
The term “stock screener free online” indicates using browser-based tools that let investors filter stocks by criteria like price, volume, and performance. These tools provide live data and basic screening features at no cost.
Stock screener free download
The phrase “stock screener free download” refers to downloadable software that allows users to screen stocks offline. These apps typically offer detailed filters and analysis tools without any charge.
Stock screener free app
The query “stock screener free app” points to mobile solutions for screening stocks on the go. These applications deliver a user-friendly interface, syncing capabilities, and a wide range of screening criteria for efficient analysis.
Best stock screener free
The expression “best stock screener free” means finding top-rated free tools that offer robust filtering, real-time data, and actionable insights. These screeners aid both newcomers and seasoned traders without any subscription fees.
Best stock screener
The term “best stock screener” suggests tools that blend comprehensive filters, intuitive design, and reliable market data. Investors often choose these for their balance of functionality and ease, tailored to various trading styles.
U.S. stock screener free
The query “u.s. stock screener free” highlights screening tools focused on American markets. They provide tailored filtering options, live updates, and in-depth domestic market metrics to support U.S. investors.
TradingView
The mention of “TradingView” refers to a popular platform offering advanced charting and screening tools for multiple asset classes. Its reputation comes from combining technical insights with a visually appealing, user-friendly design.
TradingView stock screener
The term “TradingView stock screener” denotes TradingView’s tool that helps filter stocks based on metrics like price, volume, and technical indicators. It provides an intuitive system that simplifies the screening process.
What is the most successful stock screener?
The query “what is the most successful stock screener?” indicates a search for tools known for accuracy and robust features. Success can vary by need but often involves live data, detailed filters, and user-friendly interfaces.
What is the 3-5-7 rule in stocks?
The phrase “3-5-7 rule in stocks” describes a method for evaluating investments by examining short-term, medium-term, and long-term performance. It helps investors assess both risk and potential growth across different timeframes.
Can ChatGPT analyze stocks?
The query “can ChatGPT analyze stocks?” implies using AI for market insights. ChatGPT can explain market trends and financial terms but does not offer real-time data or personalized investment advice.
Which stock screener is best for beginners?
The question “which stock screener is best for beginners?” suggests finding tools with clear, straightforward interfaces. These screeners offer easy-to-use filters combining essential technical and fundamental metrics to guide new investors.