
Have you ever thought about whether class averages differ just by chance or if there’s something more behind it? With analysis of variance (ANOVA), you can break down the overall differences and separate the real changes from everyday randomness. It works by splitting the total variation into parts coming from the group differences and parts from random noise. In simple terms, this method turns plain numbers into clear insights so you can really see what’s affecting your data. Stick with us as we explore how comparing group averages this way can completely change your view on the data.
ANOVA fundamentals: core concepts for comparing group means
ANOVA is a handy tool used to see if the averages of three or more groups differ in a meaningful way. It works by breaking down the overall differences in data into two parts: one part comes from the differences between group averages, and the other comes from the everyday random differences within each group. For example, if you compare the test scores of students in three different classrooms, ANOVA helps you figure out if the score differences are more than what pure chance would cause.
In simpler terms, the method splits the variation into two pieces. The first piece focuses on the differences between groups by looking at how far each group’s average is from the overall average. The second piece looks at the natural wiggle room or variability among individual scores within each group. Imagine you’re comparing a classroom’s average score against the whole school’s average, all while noting how varied the scores are inside each classroom.
Instead of running lots of separate t-tests, which can increase the chance of errors, ANOVA bundles all comparisons into one solid analysis. This way, you avoid the pitfalls of error buildup and gain a clearer, more reliable picture when weighing multiple group averages together.
analysis of variance: Smart Mean Comparison
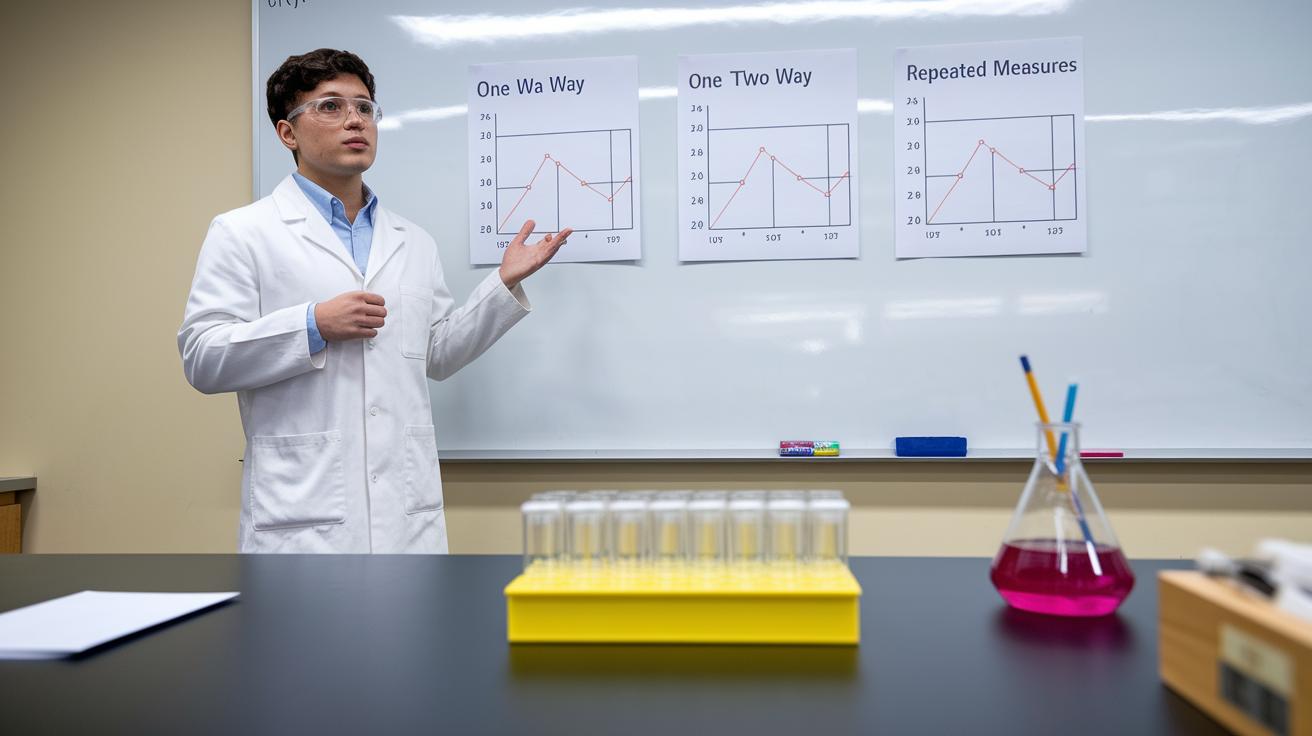
Picking the right ANOVA method is key to making sure your study fits your data and research design. Different types help you see how various factors affect a continuous outcome, each in its own way. For example, one-way ANOVA is great when you have a single category to compare, while two-way ANOVA helps you explore how two different factors interact. And if you're measuring the same subjects several times, repeated measures ANOVA is your best friend.
| ANOVA Type | Factors Considered | Practical Example |
|---|---|---|
| One-way | One categorical variable | Comparing salaries based on education level |
| Two-way | Two categorical variables | Looking at screw weight by production line and shift |
| Repeated measures | Same subjects over different times | Monitoring daily coffee intake among students |
In real research, your choice of ANOVA type depends on your question and how you gathered data. With one-way ANOVA, you check how one factor affects a result; if you’re comparing only two groups, it works much like a t-test. Two-way ANOVA lets you dig deeper by spotting interactions between two factors, which can be really telling. And when you study the same group over time, repeated measures ANOVA reveals trends and shifts as they happen. This careful choice lets you get clear, strong results from your data.
Key assumptions in analysis of variance
When you run an analysis, you need to make sure some basic rules are in place. These rules are like the foundation of a building, they help keep everything steady. If you skip checking these, your results might lead you astray.
Every statistical tool relies on these rules to work correctly. Ignoring them can give you the wrong idea about your data. So, it’s always smart to check them out before you dive into the numbers.
- Normal distribution: The leftover values (or residuals) in each group should roughly form a bell-shaped curve. In plain language, the numbers should be evenly spread around the average.
- Homogeneity of variance: The spread (or variance) in each group should be about the same. If the groups are very different, tests like Levene’s can pick up on it and suggest you try something like Welch’s ANOVA.
- Independence: Data points in one group shouldn’t affect those in another. Each observation should stand on its own.
- Scale of measurement: The number you’re measuring should be at the interval or ratio level. This means the data has a clear order and equal gaps between numbers.
- Sphericity: In tests that repeat measurements on the same subjects, the differences between all group pairings need to be roughly equal.
Before running your analysis of variance, it’s a good idea to test these assumptions. Tools like residual plots can help you see if the data looks normal, and Levene’s test checks if variances match up. Taking these steps lets you know your ANOVA results are solid and truly reflect your research.
Step-by-step calculation process for ANOVA

When you want to find out if different groups truly differ from one another, you use an analysis called ANOVA. First, gather your data by sorting it into groups and checking each group’s average. Then, calculate the overall average of every data point. This overall average acts as a benchmark to see how groups differ and how consistent each group is.
Next, measure the gaps between groups. To do this, compute the sum of squares between groups (SSB). This just means you’re looking at how far each group’s average strays from the overall average, taking into account the number of data points in each group. After this, calculate the sum of squares within groups (SSW) by adding up the squared differences between each data point and its own group average. Imagine comparing test scores in different classes: SSB shows you how much each class average differs from the overall average, while SSW tells you about the spread of scores within each class.
Then, figure out the degrees of freedom. For the differences between groups, subtract one from the number of groups (k – 1). For the differences within groups, subtract the number of groups from the total number of observations (N – k). In plain language, “degrees of freedom” mean the number of values that can vary when you’re calculating a statistic. Dividing SSB and SSW by these degrees of freedom gives you the mean squares (MSB and MSW).
Finally, get the F-statistic by dividing MSB by MSW (F = MSB/MSW). You then use this F value with an F-distribution to find a p-value. A low p-value tells you that the differences in group averages are statistically significant and likely not just by chance.
Implementing ANOVA in R, Python, and Excel
In R you can run a one-way ANOVA using the aov() function. First, load your dataset and set up your model with a proper formula. Then call aov() to do the test. Running summary() on your model will show you key numbers like the F-statistic, degrees of freedom, and p-value. If you need more details, try the TukeyHSD function to check which groups differ. One user even said that using aov() and TukeyHSD cleared up subtle group differences right away.
In Python the statsmodels library makes ANOVA quite simple. Start by importing ols from statsmodels.formula.api to create a model linking your variables. After fitting the model, pass it to anova_lm() and you will get a table with degrees of freedom, sum of squares, and the F-statistic. You can always do extra comparisons if you want to dive deeper. It’s a bit like putting together puzzle pieces to see the whole picture.
In Excel, the Data Analysis ToolPak helps run an ANOVA smoothly. Once you enable the tool, choose either ANOVA: Single Factor or ANOVA: Two-Factor depending on your study design. Input your data range, check your settings, and run the test to view your F value, p-value, and other results. If you need to compare the groups further, you can do it manually or use other built-in Excel functions. It really feels like following a straightforward recipe to bring out the differences between groups.
Interpreting ANOVA results and post-hoc analysis

When you look at an ANOVA table, keep an eye on three main numbers: the F-statistic, the degrees of freedom, and the p-value. For example, you might see F(2, 27) = 4.56 with p = 0.019. This tells you that the differences between groups are big enough compared to the differences within groups, so you can be pretty sure the results aren’t just a fluke.
It’s just as important to calculate and understand the effect size. This is often shown as Eta squared (η²) or partial η², and it tells you what portion of the total variation is due to differences between groups. To put it simply, an Eta squared value of 0.25 means that 25% of the overall differences in your data come from the varying group means.
Once you’ve found a significant effect, using a post-hoc test like TukeyHSD can clear up which specific groups are different. In other words, it breaks the overall effect into individual pairwise comparisons. Be sure to record the details, like the exact differences and whether they are statistically significant, to help explain the findings clearly.
Real-life ANOVA examples in research
ANOVA is a handy tool in research. It helps us compare group averages in simple, measurable ways.
One way ANOVA looks at salary differences among professionals with various education levels. It not only spots these differences but also picks up on local economic factors that might affect pay. For example, comparing the earnings of people with bachelor's, master's, and doctoral degrees can show if more education means better pay. Imagine checking regional trends to see why one area might have a steeper salary jump than another.
Another one-way ANOVA study might track how much coffee students drink in different fields, like arts, sciences, or engineering. This method goes beyond just a basic comparison by hinting at lifestyle factors such as heavy study loads or sleep habits that influence coffee consumption. Have you ever wondered if exam stress in one major makes students turn to more coffee than in other majors?
A two-way ANOVA is also useful. In a factory setting, it can show how different production lines and work shifts impact the weight of screws. This analysis reveals small interactions between shifts and machine performance that can subtly affect how a screw is made. Think of it as checking if varied maintenance routines during different shifts lead to slight changes in product weight.
Repeated measures designs are another example. Here, researchers track the blood pressure of patients at four different times. This method highlights trends that might be linked to factors like diet or the timing of medications. Picture watching small changes in the same individuals as they respond to a new treatment plan.
Limitations and best practices in analysis of variance

When the data doesn't spread out as expected or follow a normal pattern, results might come out wrong. Outliers, those unusual data points, can really twist the picture, making it hard to trust what you see.
It’s also key to have the right kind of data, usually interval or ratio, and to work with enough samples in each group. Small groups can exaggerate differences, and if you don’t use the proper type of data, the results of your ANOVA might be off.
Before you run an ANOVA, take a moment to check that your data acts the way it should. Look at things like whether the leftover values (residuals) follow a normal curve and if the spread is about the same across groups. Tools like residual plots and Levene’s test can help spot any problems. This step sets you up with a strong, solid analysis.
It’s always a smart idea to test these assumptions first. And if things aren’t equal, like when groups have different variances, try using Welch’s ANOVA instead, which handles the unevenness better. New methods, like bootstrap approaches and other robust designs, also offer ways to manage these issues for more reliable outcomes.
Final Words
In the action, we explored how analysis of variance helps compare group means by breaking down overall variation. We covered core concepts, various ANOVA types, and key assumptions that keep your test solid. You saw the step-by-step calculation process, learned to run tests in R, Python, and Excel, and discovered real-life examples that show ANOVA in practice. We even touched on limitations and best practices to manage risk. Keep this insight in mind as you make smart, confident moves in your investments.
FAQ
Q: What is analysis of variance definition in statistics?
A: The analysis of variance (ANOVA) is a statistical method used to compare three or more group means by separating total variation into components due to group differences and random error.
Q: What does analysis of variance tell you?
A: The analysis of variance informs you about whether significant differences exist among group means, indicating if observed variations are likely due to true group effects rather than random chance.
Q: What is the ANOVA test used for?
A: The ANOVA test is used for determining if three or more groups have different means by evaluating the variability between groups compared to the variability within groups.
Q: How is ANOVA calculated?
A: ANOVA is calculated by finding group means and the overall mean, computing sums of squares for both between-group and within-group variations, determining degrees of freedom, and then deriving the F-statistic.
Q: Is there an ANOVA formula?
A: Yes, the ANOVA formula is expressed as F = MSB/MSW, where MSB is the mean square between groups and MSW is the mean square within groups, calculated from their respective sums of squares and degrees of freedom.
Q: Where can I find analysis of variance PDFs or PPTs?
A: Analysis of variance PDFs or PPTs are available as educational resources that provide clear definitions, formulas, and examples to help you understand and present ANOVA concepts effectively.
Q: What is an analysis of variance calculator?
A: An analysis of variance calculator is a tool that simplifies the ANOVA process by automatically computing sums of squares, degrees of freedom, mean squares, and the F-statistic for quick interpretation.
Q: How does post hoc analysis relate to ANOVA?
A: Post hoc analysis in ANOVA is performed after finding a significant F-test result; it helps identify which specific group differences are driving the overall result, often using tests like TukeyHSD.
Q: What does statistical inference mean in ANOVA?
A: Statistical inference in ANOVA means drawing conclusions about population group differences from sample data by determining if observed variations are statistically significant or likely due to chance.
Q: How are probability and statistics applied in ANOVA?
A: In ANOVA, probability is used to assess the likelihood that observed differences occurred by chance, while statistical methods quantify group variability and support data-driven decisions about group means.
Q: How do standard deviation and correlation connect with ANOVA?
A: Standard deviation measures the spread of data within groups, and while correlation assesses the relationship between variables, both concepts complement ANOVA by providing insight into data variability and associations.