
Have you ever felt like your trading plan could use a little extra spark? Advanced stock screeners help you sift through piles of market data quickly. They change endless rows of numbers into clear, simple insights that make spotting promising stocks a breeze.
Imagine setting up a basic rule that shows you stocks with strong earnings and steady trends. Then, in just moments, an interactive dashboard gives you a snapshot of what’s happening. This clever system saves you from nonstop chart-checking so you can focus on making smarter investment choices.
Core Components of Advanced Stock Screener Features
At the core of this stock screener is a strong filtering engine paired with a smart data layer. It lets you sift through thousands of stocks by using simple rules, like checking earnings, revenue, or P/E ratios. You can mix in technical signs (like trends in stock prices) with how well a stock has performed, and even choose by industry or sector. Imagine typing "find stocks with revenue growth over 8% and P/E ratios under 18" to quickly narrow down a huge list into a set of promising choices. This setup transforms raw market data into useful insights so you spend less time digging and more time deciding.
The interactive dashboard makes everything easier to understand. It shows clear, color-coded heatmaps that give you a quick look at how different sectors are doing. There are also tables that put over 4,000 financial numbers side by side, so you can compare them at a glance. It’s like getting a snapshot of the market that tells you right away, "Hey, look how the tech sector is doing while others are not," helping you spot changes immediately.
Pre-built report templates are another key part of the screener. They let you create custom reports, portfolio summaries, and market updates with just a few clicks. These templates combine many data points into one clear view, freeing you from tedious manual work. This way, you can concentrate on making smart investment choices while the system handles the heavy lifting.
Advanced Stock Screener Technical Analysis Toolkit
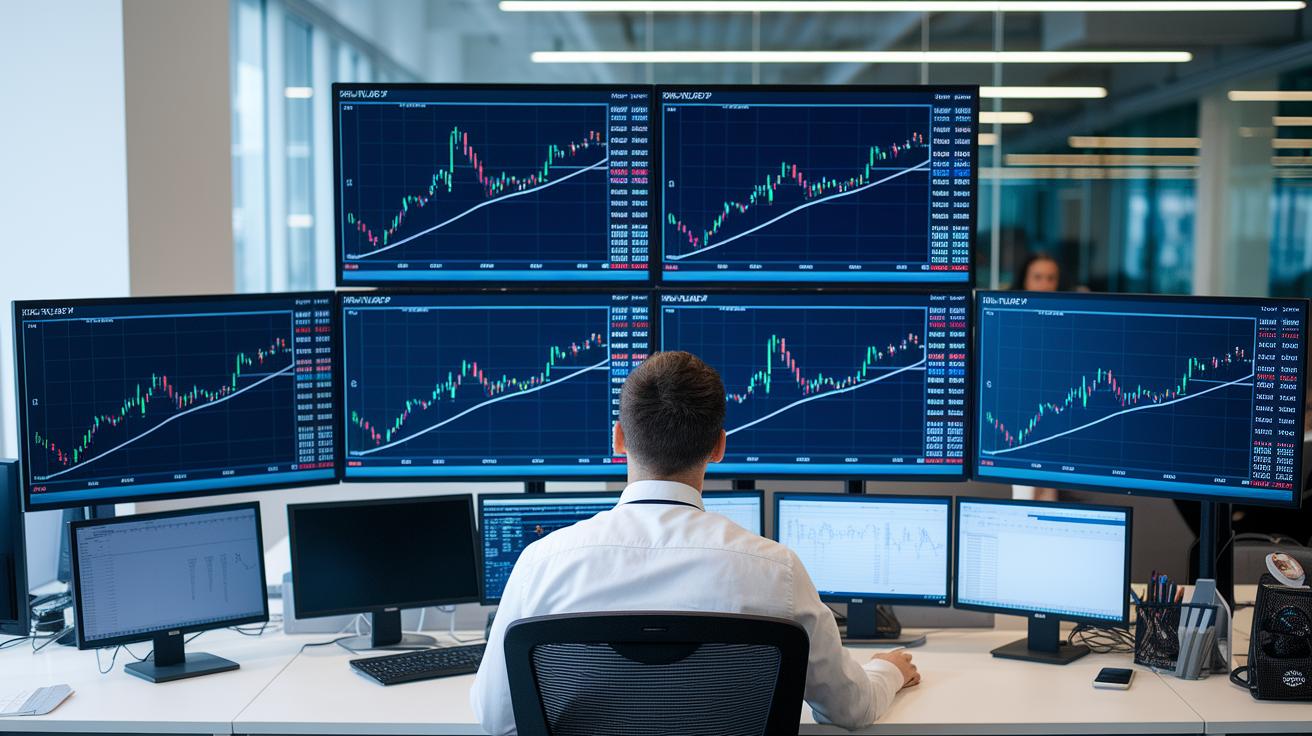
This toolkit gathers essential indicators like RSI, MACD, moving averages, Bollinger Bands, and ATR (a tool that measures how wildly or calmly a stock moves). It uses smart, algorithm-driven scanners to follow price moves, track momentum, and even catch early signals when a stock might be heading for a breakout. It’s like having a handy assistant watching the market for you, spotting crossovers and sudden trend shifts on the fly. Plus, it includes tools like a relative strength checker and volatility trackers that help you see when a stock might be on the move. All this turns a mountain of market data into clear, easy signals so you can make well-timed choices.
Chart Overlays & Drawing Tools
Using trendlines, Fibonacci retracements (which point out possible reversal areas), and simple notes, you can mark up your charts to reveal hidden patterns. For example, drawing trendlines can show shifts in momentum, while Fibonacci retracements help indicate where prices might pull back. Annotations capture key support and resistance levels, giving you visual clues about how the market is behaving. For more details, check out how to read equity market charts.
The toolkit doesn’t just set things in motion and wait. It continuously scans for fresh signals, like tweaks in candlestick patterns or breaks in important support levels. When a significant move happens, you get an instant alert, so you’re always ready to react based on real-time market action.
Advanced Stock Screener Fundamental Evaluation Modules
This module helps you quickly check a company's financial health by offering many easy-to-use filters. It looks at things like earnings growth, free cash flow yield (how much cash a company makes after expenses), P/E ratios (a simple measure of stock price relative to earnings), dividend yields, revenue trends, and profit margins. Think of it as a handy tool to find companies with strong earnings and steady growth. For example, one part of the tool zeroes in on companies with steady profits, while another highlights those with tight cost control. All of these filters make comparing companies much simpler.
You can also create custom scores by giving extra weight to key factors like return on invested capital (ROIC) and debt-to-equity ratios (a look at a company’s debt against its own funds). With a mix of different metrics, like financial ratios, beta coefficient (a measure of how volatile a stock is), and market cap (the total value of a company’s stock), this module pulls in extra research to give you a full picture of each company. This layered approach blends hard data with expert forecasts to help you make smarter investment choices.
Advanced Stock Screener Real-Time Data Integration & Alerts
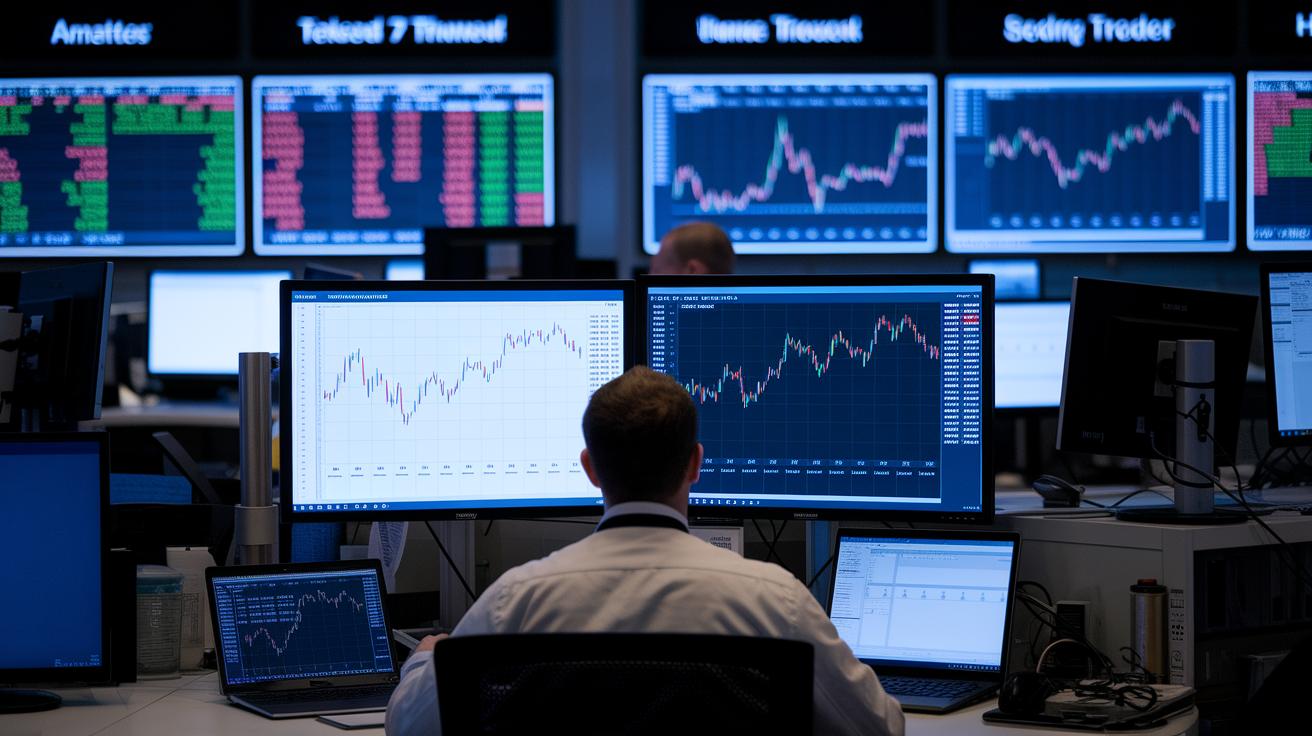
Premium screeners keep a close eye on the market for you, tracking every price change, chart shift, and uptick in volume as it happens. Our system brushes through thousands of stocks nonstop, picking up on technical cues and sudden market moves in real time. It’s like having a dedicated friend watching the market around the clock so you never miss a beat.
Setting up alerts for price moves, volume changes, technical signals, and news updates is a breeze. You can easily get push notifications on both your desktop and mobile whenever your set conditions are met, such as a rapid price shift or an unexpected spike in trading volume. Plus, integrated news feeds bring breaking headlines directly to your screen along with your screening results. This smart setup empowers you with timely alerts, helping you stay engaged and make confident, data-driven decisions.
Advanced Stock Screener Backtesting & Risk Control Modules
Backtesting modules let you test your screening ideas using past market data. They recreate old market situations so you can check how your strategy might have worked before. This way, you get a feel for things like return on investment, win/loss ratios, and how deep losses might be. Think of it like a practice run that lets you adjust your filters and risk control tools, so your strategy stays smart and steady no matter how the market shifts.
| Metric | Definition | Purpose |
|---|---|---|
| ROI | Return on Investment | Helps you see overall gains or losses |
| Max Drawdown | Largest drop from a peak | Shows your worst possible loss |
| Sharpe Ratio | Return compared to volatility | Measures risk-adjusted performance |
| Sortino Ratio | Focus on downside risk | Gives a look at return with a penalty for losses |
| Beta | Market comparison | Compares volatility with a benchmark |
By using methods like efficient frontier analysis and benchmark comparisons, you can really fine-tune your screening. These techniques help point out the best mix of investments based on what you expect to earn and how much the market might jump around. Comparing your results with major market indices lets you adjust your approach to focus on returns that match the risk. In short, this careful tuning turns numbers into clear, practical insights that help you make well-informed, data-driven investment choices.
Advanced Stock Screener Automation & Integration Capabilities

At the core of our workflow is API connectivity that keeps everything running smoothly. RESTful APIs let you pull custom data and run live queries, acting like a bridge between raw market data and the insights you build. This integration means you can add external data easily without missing a beat. If you need to hook up your portfolio tracker, have a look at the portfolio tracker API integration guide for a clear, step-by-step walkthrough.
Our platform also uses machine learning modules to deliver AI-powered insights. These tools offer predictive scoring and can spot patterns to reveal new opportunities in real time. Plus, the data mining engine lets you set up custom ratios and multi-factor models. This means you can fine-tune your screening process with easy-to-understand quantitative tools, turning repetitive work into quick, efficient actions that save you a lot of time.
Scheduling & Preset Management
Setting up regular scans and auto-delivery of reports is a breeze with our scheduling and preset features. You can plan your screeners to run at set intervals and have fresh reports delivered automatically, keeping you in the loop at all times.
To top it off, you can easily customize modules and integrate third-party tools. Whether you’re exporting data to Python or Excel for a deeper dive or adding extra research tools, our system fits right into your workflow. It creates a connected, hassle-free analysis environment that works as hard as you do.
Comparative Analysis of Advanced Stock Screener Platforms
When you’re picking a stock screener, it’s helpful to think about three main things: the data it offers, the cool features it has, and what it costs. Some screeners supply global data along with detailed market insights, while others keep things simple and even free. Your choice depends on how you invest – whether you need quick market snapshots, live updates, or advanced tools like heatmaps and sector rotation charts. In short, balancing these factors helps you find a platform that suits both your analysis needs and your budget.
| Platform | Data Coverage | Key Advanced Features | Pricing |
|---|---|---|---|
| FINVIZ Free | Delayed quotes; basic charts | Standard filter sets | Free |
| FINVIZ Elite | Real-time updates on global equities | Intraday charting tools; expanded filters | Subscription-based |
| Investing.com | Data on over 160,000 stocks from North America, Europe, and Asia | Advanced templates and heatmap displays | Competitive pricing |
Matching the right platform to your needs is key. Think about whether you require live data for active trades or broader global information for a wider view of the market. Consider which features – like technical indicators or clear visuals – will best support your investment strategy. In the end, this side-by-side look makes it easier to choose a tool that gives you the insight to make confident, well-informed decisions.
Final Words
In the action of exploring dynamic filtering engines, vivid chart overlays, detailed financial evaluations, and automated report exports, we saw how these modules work together to create a comprehensive screening experience. Breaking down everything from risk controls and backtesting tools to integration with automation setups helps simplify decision-making.
This glance underscores the true benefits of advanced stock screener features for managing risk and staying on top of market trends. It’s an exciting time for investors eager to sharpen their strategy and take charge of their financial future.
FAQ
What are the best advanced stock screener features and are free options available?
The best advanced stock screener features include robust filtering, data intelligence, dynamic visuals, interactive dashboards, and customizable reports. Free versions handle basics, while paid options offer full-spectrum analysis and deeper insights.
Which stock screeners serve well for beginners and swing trading?
For beginners, a clear interface with simple filters is key, while swing traders need real-time data and technical indicators. Many screeners tailor features to suit various trading styles and experience levels.
What are some advanced stock screener techniques?
The advanced stock screener techniques involve combining multiple criteria, using custom scoring models, and backtesting historical data. These methods help traders spot trends, assess risks, and fine-tune their strategies.
What does the 7% rule in stock trading mean?
The 7% rule in stock trading is a risk management guideline suggesting a target return of about 7% per period while setting stop-loss levels to limit downturns. It aids in maintaining risk-reward balance.
Is a premium stock screener worth it and which is the best paid option?
The premium stock screener is worth considering if you desire real-time data, advanced analytics, and automated alerts. It often provides comprehensive insights and customization that free tools may not offer.
What defines the most successful stock screener?
The most successful stock screener blends user-friendly design, extensive filters, real-time updates, and robust backtesting. Its success hinges on aligning features with personal trade tactics and risk comfort levels.
How do stock screeners with alerts work?
The stock screener with alerts sends notifications for price changes, volume spikes, and technical triggers on desktop or mobile. This instant feedback helps traders react swiftly to market movements.