Have you ever noticed your chart software might be slowing down your trades? Many traders get really frustrated when their tools lag and they miss important details. In our test, we put some of the top technical analysis programs to work, checking how fast they run, what smart features they offer, and the kind of support they give you. We looked at platforms that traders trust because of their strong performance. So, if you're wondering whether your software is up to the task or if it’s time for a switch, keep reading and find out.
Top Performing Technical Analysis Software Platforms in 2023
We’ve handpicked these platforms by looking at speed, features, and trustworthiness. We checked how fast they load data, which tools they offer, and if you get real-time info when you need it. Plus, we looked for platforms that are easy to use and come with solid customer support so your trading experience stays smooth even in a fast-changing market.
- Thinkorswim: TD Ameritrade’s desktop platform has been trusted by traders for over 10 years.
- TradingView: Enjoy quick, reliable charts at a price that won’t break the bank, along with global market coverage.
- TrendSpider: This tool uses AI (artificial intelligence, which means smart tech that learns patterns) to spot trends and automates backtesting so you can make more informed decisions.
- MetaStock: Since its debut in 1985, it’s offered more than 300 charts and indicators to help you see market trends clearly.
- eSignal: With a long history in financial analysis, it delivers strong technical charts and market data.
- Bookmap: Perfect for day traders, it shows real-time order flow in a clear, visual way.
- NinjaTrader: A cloud-based platform that works well on multiple devices, making futures trading easier.
- TC2000: Combines deep charting with handy tools for options screening and keep-a-record journaling.
- Stock Rover: Integrates with over 1,000 brokerages, making it great for those with a long-term investment focus.
- Benzinga Pro: Keeps you in the loop with live news feeds and actionable market alerts.
- SlopeCharts: A browser-based system that lets you view multiple charts at once for flexible analysis.
- StreetBeat: Automates trade execution using simple rule-based strategies for efficient trading.
We put this list together by testing real-world performance, exploring features, and checking how dependable each platform is under pressure. If you’re curious to dive deeper into the basic ideas behind these methods, check out Technical Analysis of the Financial Markets at https://tradewiselly.com?p=385.
Essential Features of Advanced Technical Analysis Tools
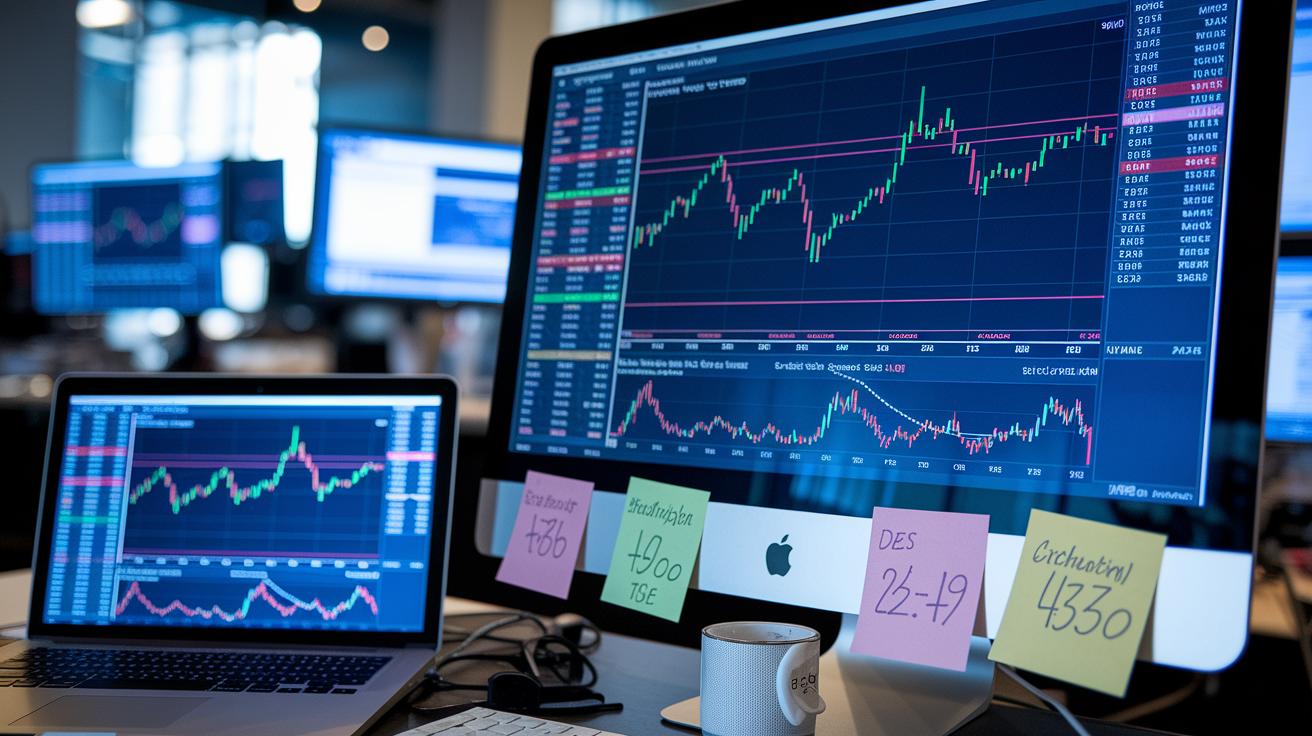
Interactive charts are at the heart of these trading platforms. They let you review market trends over different timeframes, making it simple to gauge what's happening. Each chart comes with built-in drawing tools, so you can easily mark trends, patterns, and important price levels. For example, if you check out this charting tool in technical analysis, you'll see how raw numbers transform into clear, useful insights. It really feels like having a chat with the market itself.
These advanced platforms also pack a wide range of indicators such as moving averages, RSI (that’s the Relative Strength Index, which shows how fast prices are moving), MACD, and Bollinger Bands. These tools break down price movements into data that you can actually use. On top of that, backtesting modules, like TrendSpider Backtesting 2.0, let you simulate how strategies would have worked in the past. And if you love fine-tuning, automated pattern detection can quickly spot formations like head-and-shoulders or triangles, while custom scripting lets you adjust strategies to match your own style.
Real-time alerts and ultra-fast data feeds make sure you get market signals without any lag. Whether you’re on your desktop, browsing online, or using a mobile app, cross-device syncing keeps you in the know wherever you are. This mix of speed, accuracy, and flexibility makes these platforms a great fit for both quick, active trading and more thoughtful, strategic decisions.
Pricing and Trial Options for Best Technical Analysis Programs
When you search for technical analysis software, it helps to know how the pricing works. Many programs offer a free version so you can explore the basic functions without spending any money. The paid plans usually give you extra charts, detailed backtesting tools (to see how a strategy might have performed in the past), and real-time alerts that keep you in the loop.
A lot of platforms also let you try out a free trial period. This way, you can test if the extra features are really what you need before you spend any cash. It’s all about matching the software with your strategy and making sure it feels simple and dependable. In truth, comparing the cost options with the trial offers helps you find a tool that fits your trading style and your budget.
| Software | Free Tier | Paid Tier Price Range | Trial Availability |
|---|---|---|---|
| TradingView | Free Basic | $14.95 – $59.95 | 30-day Free Trial |
| Thinkorswim | No Subscription Fee | N/A (TD Ameritrade Account Required) | Paper Trading Included |
| MetaStock | N/A | $99 – $279/month | 10-day Trial |
| TrendSpider | N/A | $33 – $99/month | 7-day Free Trial |
| TC2000 | N/A | $9.99 – $99.99/month | 14-day Free Trial |
| Bookmap | N/A | $49 – $99/month | 14-day Trial |
| eSignal | N/A | $65 – $250/month | 30-day Trial |
| Stock Rover | N/A | $7.99 – $49.99/month | 30-day Trial |
Trial periods let you check out live data feeds and hands-on features without putting money down first. This makes it easier for you to decide if a basic free version meets your needs or if the extra tools in a paid plan can boost your trading game.
Comparing Technical Analysis Software by Trading Style: Intraday, Swing, Forex, Crypto

Technical analysis software can be adjusted to match different trading styles. Each style has its own needs, whether you make rapid moves throughout the day, hold on to trades for several days, work with currencies, or take on crypto’s wild swings. The right software can make all the difference in how you read market signals and insights.
For intraday traders, platforms like Bookmap let you see tiny shifts in market orders. It feels like watching the heartbeat of the trading floor. And then there’s NinjaTrader, which is popular for futures trading and offers strong tools for those quick moves. StreetBeat is another option; it automates trading based on set rules, helping you make fast decisions.
Swing traders have their own set of favorites too. TrendSpider, for example, uses smart AI trendlines to detect longer-term changes. Imagine it as having a crystal ball that hints at market shifts. Stock Rover also adds value by showing fundamental data right on the charts, offering you a broader view of market changes. These tools let you comfortably hold positions for days or even weeks.
When you turn to forex and crypto, you get more options. MetaStock’s currency modules allow you to keep track of several pairs at once. TradingView stands out with multi-pair charts and smooth exchange links, perfect for both forex and crypto fans. And for those focused on crypto, SlopeCharts delivers detailed exchange data directly through your browser, giving you the insights needed to stay sharp in fast-moving markets.
Free vs Premium Technical Analysis Platforms: Pros and Cons
Free platforms give you the basics, like simple indicators and a few alert options to track everyday market moves. They might include ads and have a smaller set of tools, which means you get enough to do everyday trading without extra cost. For instance, TradingView Basic or Thinkorswim offer core charts and straightforward drawing tools that work well for routine trading.
These free choices work well when you're just starting or simply testing the waters before making a financial commitment. They allow you to explore key market signals without spending money. But keep in mind, their simpler features might not catch every detail during fast market changes.
Premium platforms, on the other hand, pack a lot more power. They come with a wide range of indicator sets, smart scanning features, and solid backtesting tools that let you test your trading ideas. They might even provide API access, which lets you create custom strategies with real-time data and deep analysis. This extra level of detail can be a game-changer if you need precise insights in a fast-moving market.
Choosing premium means you pay for added accuracy and extra features, along with more robust analytical support and fewer delays in data. In truth, your choice depends on your trading style and needs, whether the basic free version meets your goals or a premium tool with advanced features is a better fit.
Mobile and Web-Based Technical Analysis Apps
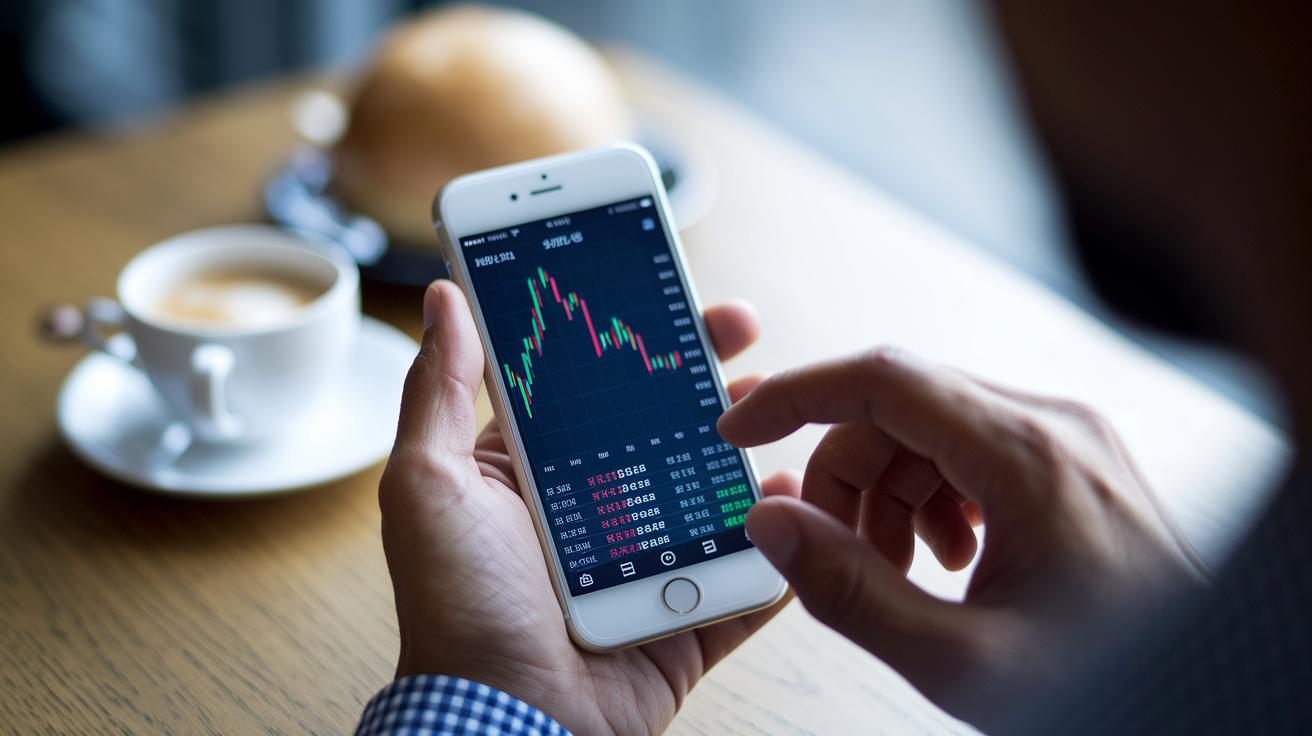
Using mobile apps such as TradingView App, Thinkorswim Mobile, StockCharts Mobile, and Benzinga Pro lets you watch the markets no matter where you are. They pack in key charting tools and basic technical indicators (which are simple measurements to help you understand market trends) straight into your phone. Many users say, "It’s like having my own mini trading desk!" These apps are built for quick, on-the-go analysis and feature a clear, friendly design.
On the web, platforms like TradingView, SlopeCharts, and the TC2000 web version provide cloud-based charting tools that work smoothly on any device. With features such as offline chart caching, you can even check out data when your internet is a bit spotty. Plus, push alerts update you on important market moves, which is handy when quick decisions are needed during fast shifts.
Both mobile and web solutions offer cross-device sync, so you can start a chart on your phone and finish it on your computer. This smooth handoff means you spend less time adjusting settings and more time catching market opportunities, giving you reliable access wherever and whenever you need it.
Best technical analysis software: Winning insights
Performance metrics are the heart of trusted technical analysis tools. Thinkorswim is known for its rock-solid desktop performance and almost no downtime, which many traders really appreciate. TradingView also stands out with load times under 200ms and a near-perfect uptime of 99.9%, so you rarely miss a live market signal. TrendSpider impresses with a backtest accuracy above 95%, thanks to smart machine learning, while NinjaTrader delivers fast order routing that is vital for futures trading. These clear benchmarks show you just how quick and efficient each platform is.
Reliability is key in a fast-moving market where every millisecond counts. eSignal has earned its reputation with decades of dependable market data that long-time users trust. On the other hand, MetaStock has had a few hiccups with latency, which cautious traders might want to note. When a system consistently performs well, it gives you the confidence to make trading decisions without worrying about delays.
User feedback also backs up these numbers. Many traders say platforms like Thinkorswim and TradingView feel like a smooth chat with the market. Plus, the powerful tools in TrendSpider help them fine-tune their strategies with ease. Traders often praise NinjaTrader for its quick order execution, proving that a reliable platform makes technical analysis both strong and easy to use.
Case Study: Talkdelta Technical Analysis Software for the Indian Stock Market

Talkdelta Software Solutions Pvt Ltd started in 2021 and has quickly become a trusted name for stock market technical analysis in India. They built a platform that brings clear, real-time market charts right to your screen, making it feel like you’re right in the midst of trading activity.
Loaded with more than 100 modules, this toolkit covers everything from VAR Analysis (a method to gauge risk) to alerts, simulations, and even synthetic futures. It’s like having a handy toolbox that helps you catch market trends and manage your trades smoothly, keeping you ready for when the market makes its move.
For those just getting started, there’s a free basic version ideal for general analysis. And if you need extra features, the advanced paid version, which comes with a license key, has you covered. Although Talkdelta is primarily built for desktop use, they’ve also developed mobile apps so you can stay connected wherever you go. Plus, real-time updates flow in from a dedicated feeds server, and you even have the option to enter trades manually.
If you have any questions or need support, just give them a call at 8069640991 or 6358012962/65. For sales inquiries, you can reach out at 8657428371/72/78.
Final Words
in the action, we reviewed top platforms focusing on performance, features, pricing, and mobile capabilities. The post highlighted insights on Thinkorswim, TradingView, TrendSpider, and others, guiding you through criteria like chart interactivity, backtesting, and reliable real-time data. For foundational concepts, check out "Technical Analysis of the Financial Markets" at https://tradewiselly.com?p=385. With clear comparisons and practical tips, you gain the confidence to select the best technical analysis software while balancing risk and staying ahead of market trends.
FAQ
Q: What technical analysis software is best according to Reddit and expert opinions?
A: Community chatter often highlights TradingView and Thinkorswim as top choices thanks to their strong reliability, cost-effectiveness, and ease of use.
Q: What free technical analysis software offers buy/sell signals?
A: Free tiers of platforms like TradingView and Thinkorswim include basic charting tools and sometimes buy/sell signal alerts, making them ideal for dipping your toes into technical analysis.
Q: Which technical analysis software is best for beginners?
A: Beginners enjoy software with simple interfaces and clear educational resources. TradingView and Thinkorswim effectively balance robust features with user-friendly tools to ease the learning curve.
Q: What is the most accurate technical analysis tool available?
A: The most accurate tools blend real-time data with extensive indicators. TradingView, with its fast data feeds and rich charting capabilities, is widely trusted for its precise market insights.
Q: Can ChatGPT analyze stock charts?
A: ChatGPT can explain charting concepts and trading strategies but cannot visually analyze live stock charts or provide real-time market data.
Q: Who is often regarded as the king of technical analysis software?
A: Thinkorswim earns high praise for its comprehensive charting, reliability, and long-standing reputation among traders, often earning it the top spot in discussions.
Q: What free charting software works well for day trading?
A: For day trading, free solutions like TradingView offer detailed intraday charting, fast updates, and intuitive tools that support quick, informed trading decisions.
For more foundational insights, check out Technical Analysis of the Financial Markets.