Ever thought a free tool might be all you need to stay ahead in the investing world? Google Finance can do just that with its smart portfolio tracker. It hooks up with Google Sheets to fetch current prices and even look at old price trends, kind of like checking a friend’s status in real time. With this setup, you can keep an eye on all the important stock info without any pricey software. In this article, we’ll guide you step by step to set up your own tracker so you can make smarter decisions with live data.
Setting Up the Google Finance Portfolio Tracker
Google Finance is a free tool that helps you keep an eye on your investments and catch up on market news. It links up nicely with Google Sheets using the GOOGLEFINANCE function. This lets you fetch live quotes and past data for stocks, ETFs, indexes, currencies, and even cryptocurrencies. It's a bit like checking up on a friend’s status in real time.
First, open your web browser and type in "Google Finance." This will take you to a page full of market details you can explore.
Next, fire up a new Google Sheet and make sure you turn on the GOOGLEFINANCE function. This function is the heart of your setup, letting you grab all the data you need.
In your new sheet, start by typing the ticker symbols (like AAPL for Apple or MSFT for Microsoft) into column A. These symbols represent the different stocks or assets you want to track.
Then use a formula like =GOOGLEFINANCE("TICKER","price") to get live prices. Just swap TICKER with your chosen symbol – for instance, =GOOGLEFINANCE("AAPL", "price") will show you Apple's current price.
For a glimpse into history, you can set date ranges with interval settings. A formula like =GOOGLEFINANCE("GOOG", "all", "2023-01-01", "2023-06-30", "DAILY") pulls daily data for that period, giving you insight into past performance.
Finally, double-check that your data syncs properly and that refresh settings are turned on. This helps keep your investment overview up to date, which is key for making smart decisions.
Google Finance Portfolio Tracker: Smart Stock Monitoring
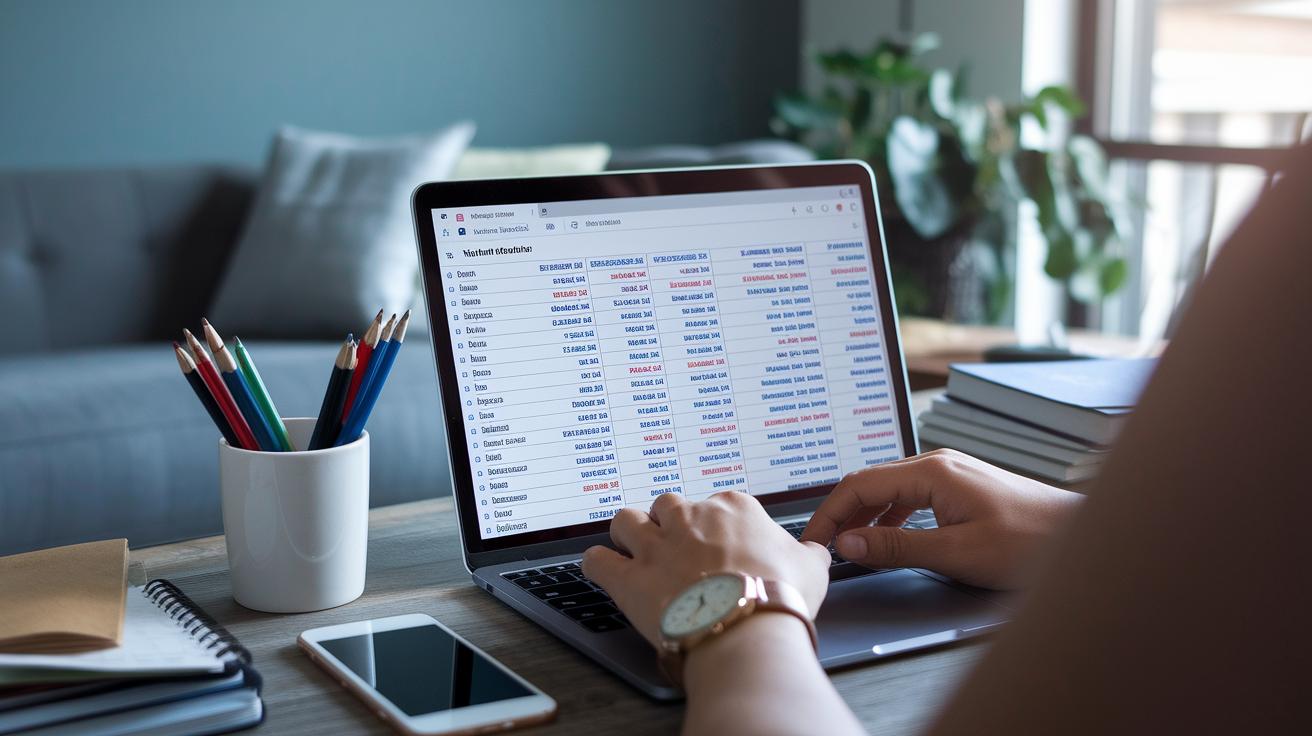
Dynamic watchlists give you a clear, real-time look at your investments. They let you check on your stocks without needing a fancy built-in tracker. With the GOOGLEFINANCE function, your data refreshes automatically as the market moves, so you’re always in the loop.
Start by listing your stock tickers in column A. Then, in column B, use a formula like =GOOGLEFINANCE("TICKER","price") to pull in the current price. In columns C and D, get the day's high and low to track how the market shifts. Next, calculate the percent change in column E with simple formulas that show daily movements. You can even add conditional formatting to highlight big changes or important thresholds.
Sorting and filtering your entries can make the watchlist even more useful. Once you’ve set up these basics, you can rearrange your data and zero in on the stocks you care about most. For more powerful features, check out some extra tools like Trading tools to boost your dynamic watchlist even further.
Automating Data Refresh with GOOGLEFINANCE Formulas
You can make your portfolio tracker work harder by setting how often it recalculates. For instance, you might set it to update every minute so you don’t miss fast changes in the market. I once saw a test where a one-minute update picked up quick price shifts that helped adjust a trade just in time.
| Formula | Description | Example |
|---|---|---|
| =GOOGLEFINANCE(“MSFT”,”price”) | Checks the live share price (the current trading price) | =GOOGLEFINANCE(“MSFT”,”price”) |
| =GOOGLEFINANCE(“AAPL”,”all”,”2023-01-01″,”2023-06-30″,”DAILY”) | Shows daily historical data (each day’s recorded prices) | =GOOGLEFINANCE(“AAPL”,”all”,”2023-01-01″,”2023-06-30″,”DAILY”) |
| =GOOGLEFINANCE(“GOOG”,”high”) | Displays the day’s highest price (the peak price during market hours) | =GOOGLEFINANCE(“GOOG”,”high”) |
When your tracker starts to get complicated, try using named ranges. This means you give a group of cells a label, so rearranging things later won’t break your formulas. Plus, by adding a little error-checking like IFERROR, you help keep your data neat and correct. It’s a good idea to test different update speeds with small changes to make sure your formulas stay on track.
Customizing the Portfolio Dashboard in Google Finance

Visual dashboards make it easy to see how your investments are spread out. They let you check your assets at a glance and quickly spot when things might need a tweak. A good dashboard turns a bunch of numbers into clear, friendly charts, like turning a messy pile of data into a neat picture. For example, a Tree Map instantly shows you each asset's share.
• Start by adding a Tree Map chart to see your asset breakdown.
For instance, highlight your asset data, click on Insert Chart, and choose Tree Map. This will show you the different slices of your investment pie.
• Next, set target percentages and limits.
For example, decide on a perfect percentage for each asset so that if prices change, any deviation will jump out at you right away.
• Then, use a Rebalance Summary table to guide your trades.
Imagine a table that tells you exactly how many dollars you need to adjust your mix, it helps keep everything balanced.
• Also, add filters for different custodians (like Fidelity versus Schwab).
With a filter button, you can easily switch views to see which investments belong to which custodian.
• Finally, apply custom colors and labels to match your personal style.
Changing chart colors and adding your own labels helps make the dashboard truly yours.
Just a word of caution: be careful when editing your dashboard. Small changes, like editing cell formats or renaming assets, might break a chart. Always back up your setup before you make any tweaks.
Integrating Google Finance Portfolio Tracker with Mobile and API Tools
With Google Sheets and Google Finance working together, you can check your stock details even when you're away from your computer. It’s like having a little financial helper in your pocket, keeping you updated as you go about your day.
Start by downloading the Google Sheets app on your smartphone. Once you open your portfolio tracker, you’ll find your live data right at your fingertips. Don’t forget to turn on notifications, this way, your phone will give you a gentle nudge when your stock prices hit the levels you’ve set, just like a friendly reminder.
Even though there isn’t an official Google Finance API, lots of people use third-party tools to keep things running smoothly. Services like Zapier or Integromat can automatically send updates from your spreadsheet to platforms like Slack or even trigger email alerts. Imagine setting up a rule so that whenever a significant price shift happens, you get an alert without needing to refresh your tracker manually.
By linking these extra tools, your tracker becomes much more powerful. Whether you're monitoring stocks, ETFs, indexes, currencies, or even cryptocurrencies, the updates happen automatically. This means your portfolio is always up-to-date, working hard for you, even when you’re busy or on the move.
Comparing Google Finance Portfolio Tracker to Other Tracking Solutions
Finding the right tool to watch your investments can feel like searching for treasure. Some platforms are free and easy to use, while others charge a fee for extra features. When you’re keeping an eye on your stocks, you want something that’s simple to set up and gives you clear, straightforward visuals, like checking the weather on your phone.
Below is a comparison of three common options, helping you decide which fits your needs in terms of ease of use, the range of tickers they cover, and overall cost.
| Feature | Google Finance | Yahoo Finance | Premium Tool |
|---|---|---|---|
| Cost | Free | Free | $99/month |
| Ticker Coverage | Stocks & ETFs (some missing) | Broad | Universal |
| Setup Time | 5 min | 10 min | 1 hr |
Each of these tools shines in different scenarios. Google Finance is ideal if you need a quick, free setup with visually clear data for basic ticker tracking. Yahoo Finance works well if you want more comprehensive ticker support without spending a dime. And if you’re after in-depth analysis and extra features to manage a complex portfolio, a premium tool might be the way to go.
Troubleshooting Common Issues in Your Google Finance Portfolio Tracker
Sometimes, while using your tracker, you might run into little bumps in the road. It’s normal, and fixing these issues fast keeps your portfolio running smooth and steady.
- If you see "#N/A" for some tickers, double-check the exchange symbol or try an alternate one.
- When your charts look broken after editing rows, try using protected ranges or add new rows above the formulas.
- If an asset-class name doesn’t update the way it should, update your named ranges.
- For funds that aren’t recognized, consider manually overriding the cell.
- If your sheet is running slow, cutting back on the historical data can help speed things up.
- And if syncing stops working, adjust your sheet’s recalculation settings.
It’s also smart to make backups and keep a version history of your tracker. Doing this means you can quickly roll back to a stable version if something unexpected happens. Plus, with version history, you can easily spot when a problem first showed up. This practice minimizes any hassle and keeps your data secure, giving you the confidence to handle any troubleshooting along the way.
Final Words
In the action, you've explored setting up a free investment overview using the google finance portfolio tracker. We walked through building dynamic watchlists, automating data refresh, and customizing your dashboard to keep things clear and personal. Mobile integration and quick fixes helped round out a system that feels both robust and easy. Enjoy the momentum of smart investing as you take confident steps toward managing risk and catching timely market insights.
FAQ
How does Google Finance function as a portfolio tracker?
Google Finance works as a portfolio tracker by using the GOOGLEFINANCE function in Google Sheets to pull live quotes, historical data, and market news for stocks, ETFs, indexes, and more.
Is Google Finance free and accessible on mobile?
Google Finance is a free tool that you can access via web browsers and through the Google Sheets mobile app, making it easy to track your investments on the go.
What happened to Google Finance portfolios?
Google Finance portfolios have been integrated into Google Sheets using the GOOGLEFINANCE function, offering a flexible way to manage and update your investment data.
How does the Google Finance watchlist work?
The Google Finance watchlist displays live market data by updating ticker symbols in your Google Sheet, so you can monitor stock prices and market movements in real time.
What do online reviews and Reddit say about the Google Finance portfolio tracker?
Online reviews and Reddit discussions show that users appreciate Google Finance’s no-cost simplicity, though some report occasional issues with ticker accuracy, making it a solid yet basic tracker.
What is the best portfolio tracker?
The best portfolio tracker depends on your needs; Google Finance, Yahoo Finance, TradingView, and MarketWatch each offer unique features, from free simplicity to more advanced tracking capabilities.
How does Google Finance compare to Yahoo Finance and other tracking tools?
Google Finance offers a no-cost, straightforward tracking system via Google Sheets, while Yahoo Finance, TradingView, and MarketWatch deliver broader market data and more detailed interfaces.
How can I integrate Google Finance data with other platforms?
You can integrate Google Finance data with other platforms by connecting Google Sheets to third-party services like Zapier, which allows you to push updates to tools such as Slack and email alerts.