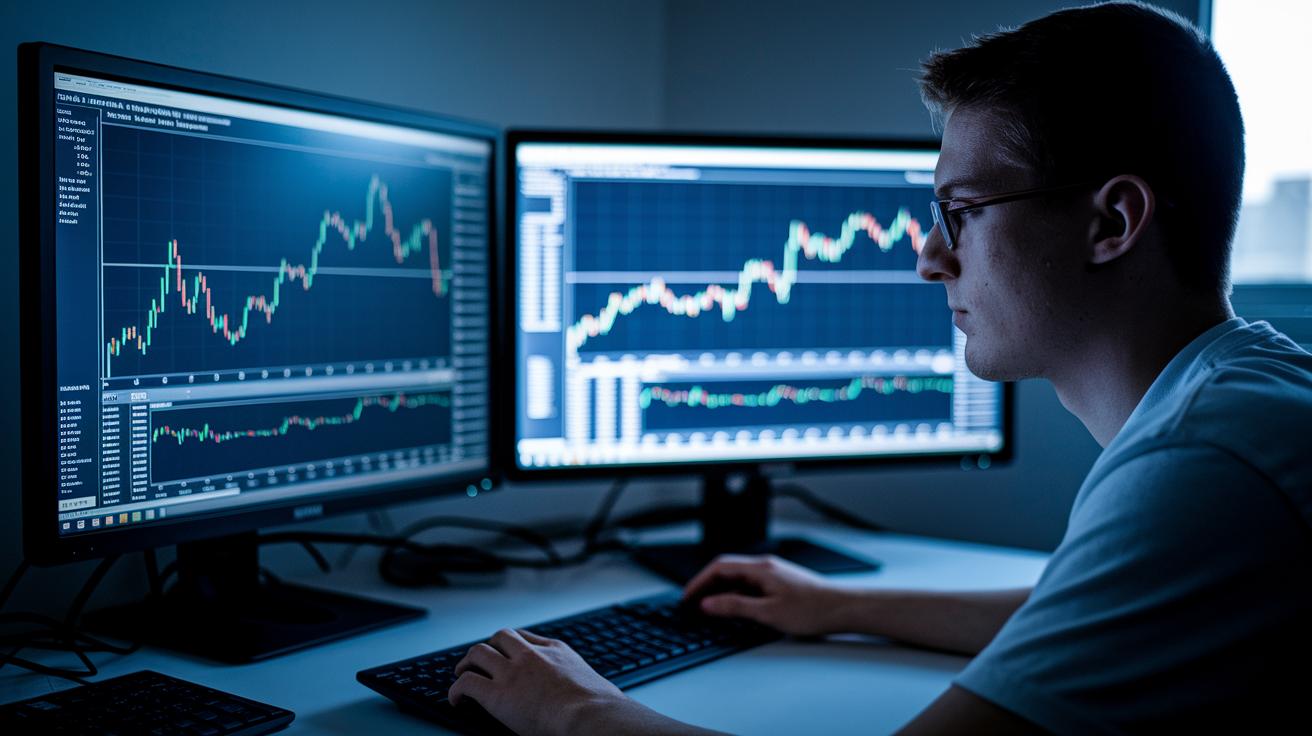
Ever wonder why some traders seem to make decisions so quickly? It might be because they’re using smart stock trading tools. These tools sift through all the market numbers and spot trends in a flash. Think of them like a trusted guide in unfamiliar territory, they turn complicated data into clear signals that you can actually use.
In this article, I'll share some clever picks that can boost your trading game. From simple charts to live market updates, these tools give you that extra edge to trade with genuine confidence. Have you ever experienced that rush of knowing you made the right move? It's something that can really change your trading journey.
Stock trading tools: Brilliant Choices for Traders
Stock trading tools are a set of online helpers that make it easier to understand market numbers, place your trades, and keep risks in check. Using a mix of these tools gives you a bunch of different views, from the charts showing trends to the real facts about companies, which can speed up your trading decisions. Fun fact: some experienced traders cut their decision time nearly in half when they use six or more different tools instead of just one.
There are seven main types of trading tools. Stock scanners quickly go through market data to find stocks that meet your rules. Charting software shows price movements and patterns that can hint at what’s coming next. News services bring you live updates about market events. Trading simulators give you a risk-free space to practice your moves, and fundamental analysis apps break down company numbers to show what really matters. Mobile trading platforms let you trade wherever you are, while digital trade journals help you keep track of your past trades so you can learn for the future.
When you mix and match tools from these different groups, you create a smooth trading process where every tool adds its own strength. Think of it like making a balanced meal: each ingredient, from a smart scanner to a clear charting tool, boosts your overall strategy and helps you trade with more confidence.
Selecting an Online Brokerage Platform for Trading
When you start trading, you want to keep fees low so they don’t eat into your profits. Many brokers such as Webull, Robinhood, and M1 Finance offer low-cost trades, while others like eToro have a unique fee structure. Some even let you trade commission-free if your account balance is higher. For example, Charles Schwab’s ThinkorSwim offers free trades for accounts over $25,000, helping you keep costs down.
Platform features also play a big role. A lot of traders look for systems that are both easy to use and work well across devices. Whether it’s the simple process of placing limit orders or having research tools built right in, you want a platform that mixes smart trading capabilities with a smooth mobile experience.
Next, fast and reliable order execution is key. Brokers like TD Ameritrade and Vanguard have systems that process trades quickly, even when the market is buzzing. After all, getting your order filled at the right time and price can really impact your trade.
Don’t forget to check out account restrictions and options. For those who need more flexible rules or different commission setups, international choices like CMEG and TradeZero might be the way to go.
When comparing broker features, keep this checklist in mind:
- Commissions: Look into low-cost or commission-free options.
- Margin: Confirm that margin rates suit your style.
- API access: Make sure developers can use the API for automation.
- Mobile app: Choose a responsive, feature-rich app.
- International trading: Consider if you want to trade outside domestic markets.
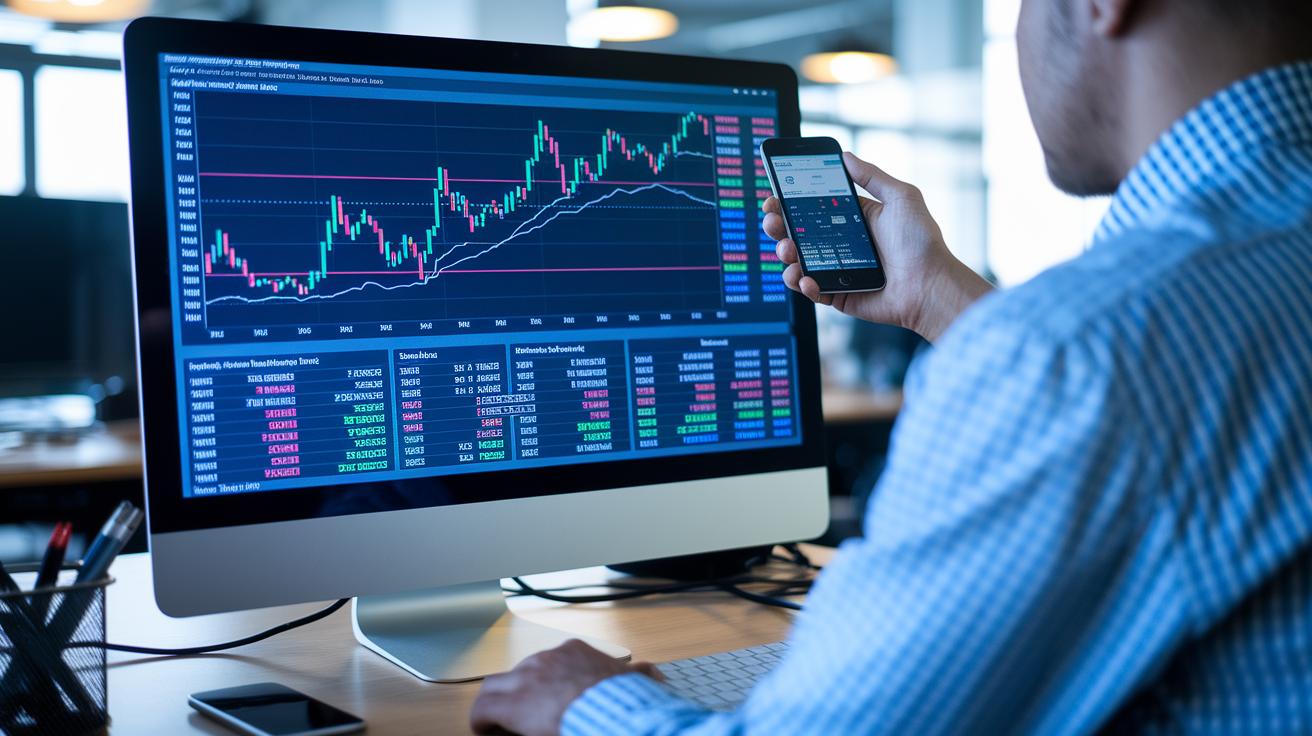
Real-Time Market Scanning and Alert Solutions
Live scanning tools work like having extra eyes on the market. They help you notice changes as soon as they happen, like spotting a sudden burst in trading volume or a price breakout. Imagine setting up a scan before the market opens so you can see which stocks match your trading style right away. It’s like watching for a little light on your screen that tells you when a stock is making its move.
Real-time alert systems give you another helpful boost. They send you quick notifications during trading hours so you don’t have to watch charts all day. This way, you can relax and work on your plan while the alerts keep you posted on big moves. It’s a bit like having a friend who calls you as soon as something important happens in the market.
Here are five scanners that can keep you in the loop:
| Scanner | Description |
|---|---|
| Trade Ideas | A powerful tool with five filters designed for $2–$20 day trades. |
| StockCharts.com | A free scanner that quickly spots key chart patterns. |
| Finviz | An easy-to-use real-time alert system for spotting volume spikes. |
| Barchart | Monitors price breakouts and other technical signals. |
| TradingView Scanner | Combines charting with live scans to spot setup opportunities. |
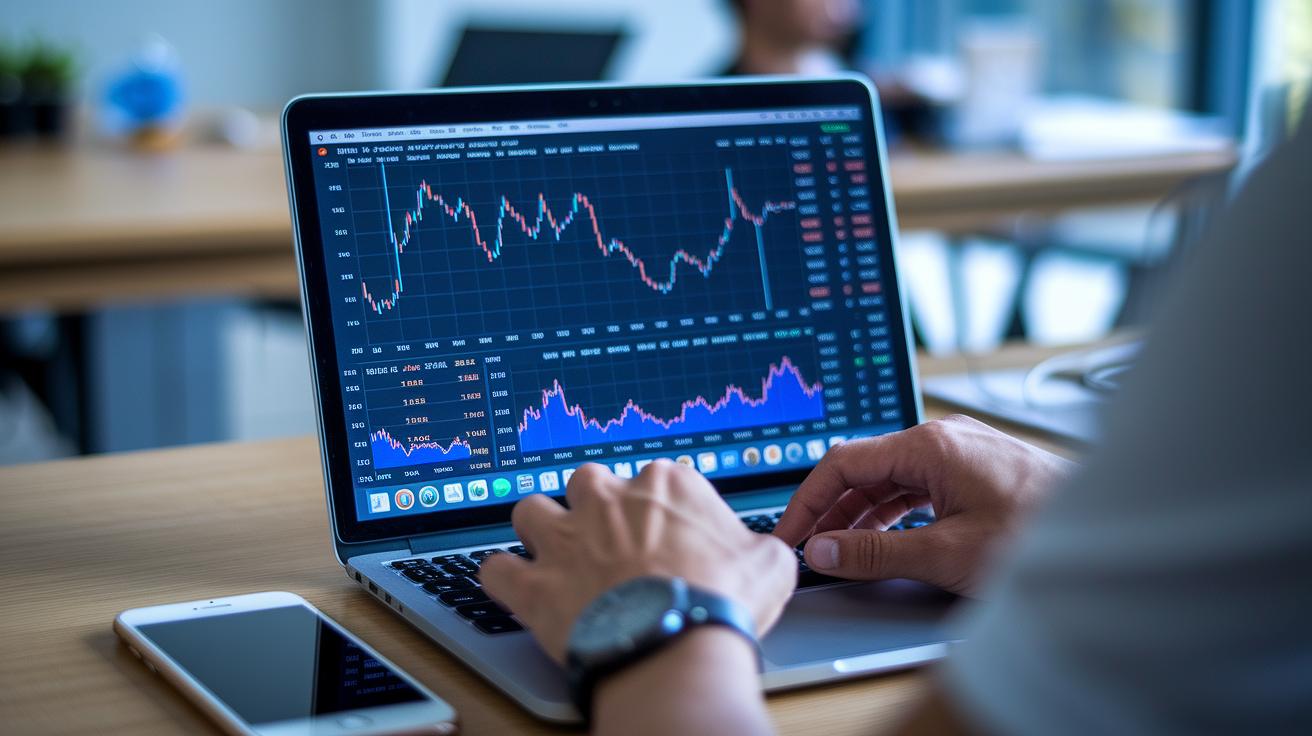
Advanced Charting Tools and Technical Analysis Platforms
Charting tools help traders see important market moves and price changes. They turn detailed data into clear, visual information that is easy to understand. With interactive chart software, even complex charts feel simple and friendly.
Take TradingView Pro+ as an example. Its setup lets you look at overall trends and small details at the same time. It is like having a smart friend who notices chart patterns such as head and shoulders or triangles. Plus, it draws lines to show key price levels where the market might change direction.
With charts that match your strategy, you can notice trends as they start. This makes it easier to decide when to enter or exit a trade.
| Platform | Main Feature | Pricing Tier |
|---|---|---|
| TradingView Pro+ | Multi-timeframe layouts, custom indicators | Mid-range |
| TC2000 | Built-in backtesting | Flexible pricing |
| eSignal | High-quality real-time data | Premium |
When you choose a charting platform, think about your trading style and your budget. Some traders like premium services with many features, while others want affordable tools that still work well. For example, learning how charts work can help decide if you need a multi-chart display or a special candlestick scanning tool.
In the end, finding a balance between useful features and cost means you gain a strong edge when making trading decisions.
Strategy Testing with Backtesting and Simulation Suites
Ever wonder if you can try out trading moves without putting your money at risk? Backtesting and simulation tools let you do just that by using old market data to practice and perfect your entry and exit points. Think of it like a dress rehearsal, eToro’s paper-trading simulator, for example, can help you feel ready before the real trade.
But these tools aren’t perfect. Simulated trades can miss a few live market quirks, so even if things look promising in theory, they might turn out differently when you trade for real. It’s a good reminder that a model's results depend entirely on its base assumptions, sometimes the ideal numbers in a simulation can fool you.
To set up a solid backtest, start by choosing a timeframe that shows different market moods. Next, clearly define your trading rules based on your chosen indicators, and run the simulation using a day simulator or a free paper-trading platform. Then, review the results to see if your strategy is consistent. You can even use options simulation tools for Greeks analysis (which is just a way to measure risk) to help fine-tune your approach before making real trades.
Algorithmic Execution and AI-Based Trading Software
Today’s market is transformed by algorithmic execution and AI-based trading software that makes trading both fast and precise. Platforms like TradeStation and IBKR API use automated order systems to spot familiar price patterns such as candlestick shapes and momentum shifts. These systems help cut down waiting time and reduce slippage, while smart tools like predictive financial analytics give you AI-backed hints about where prices might go next.
Signal Generation Modules
Signal Generation Modules use machine learning to sift through huge amounts of market data and deliver timely buy and sell alerts. They adjust on the fly as market trends change, which means you get useful signals even when things move quickly. It’s almost like having a seasoned trader close by, ready to shout out when a breakout seems to be starting.
Algorithmic Execution Engines
Algorithmic Execution Engines automatically send and place orders based on the rules you set. Whether you’re jumping on a trend or locking in a profit target, these engines act fast with very little delay. By removing human error and ensuring exact order placements, they let you trade with confidence, even when the market feels a bit wild. This mix of technology and strategy makes it easier to make smart, quick decisions.
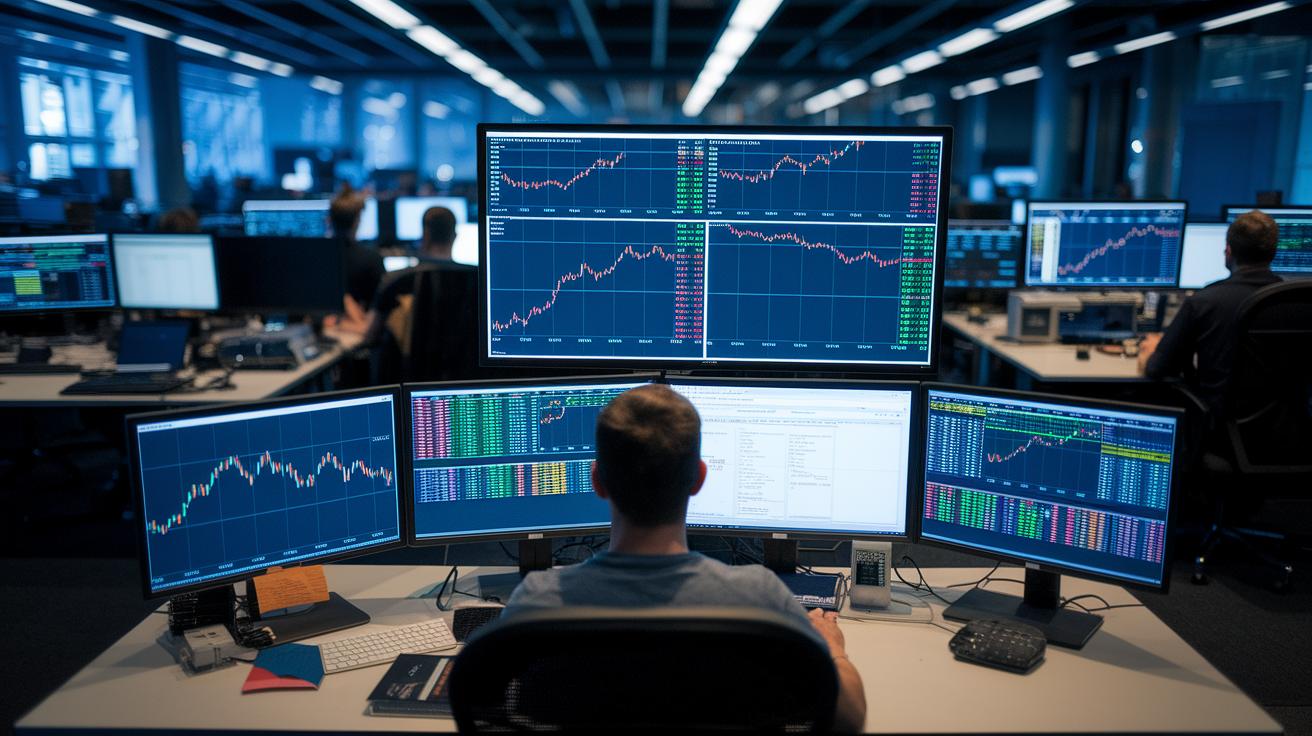
Portfolio Management Dashboards and Performance Analytics
Modern dashboards give you a clear snapshot of your trading performance. They offer portfolio overviews with features like fractional-share tracking, real-time balance updates, and interactive profit and loss heatmaps. This means you can easily see your open positions, track account changes, and check your gains or losses at a glance. Many platforms even provide a daily review that sums up key indicators, so spotting trends and adjusting strategies is a breeze.
Customized risk management tools take these dashboards to the next level. With risk/reward calculators and personal widgets, you can quickly assess potential outcomes for trades and keep an eye on your exposure in different market sectors. Plus, daily email summaries highlight any changes in gains, losses, or risk levels, helping you fine-tune your approach as new data comes in.
Mobile live charts make sure you’re never out of touch with your portfolio’s beat. These integrations bring detailed analytics right to your phone and sync seamlessly with desktop dashboards. Moreover, many platforms offer advanced financial tools that blend robust dashboard features with real-time updates, ensuring you always have the full picture wherever you trade.
Custom Integrations: APIs, Widgets, and Data Visualization
When you use our brokerage REST and WebSocket APIs, you can hook your code straight up to live market data. This direct connection lets you build custom indicators using tools like TradingView Pine Script, which is a simple way to create your own trading signals. For instance, you could set up an API module that automatically pulls current prices into your dashboard. Curious about how to blend these API modules into your system? Take a peek at these financial analysis tools.
These APIs also let you swap data between different platforms instantly. This smooth transfer of information means you can line up your trading signals with real-time market moves. You can easily tweak settings or add extra data streams as your strategy grows and changes.
Imagine setting up custom widgets that display live charts right in your own dashboard. Picture a personalized view that shows your portfolio's performance side by side with current market trends, it’s like designing your very own trading cockpit.
You can even customize alert systems to match your specific needs. By setting up webhook alerts with apps like Telegram or Slack, you'll get quick updates whenever your trade indicators fire, keeping you in tune with all the market activity.
Final Words
In the action, we explored a range of stock trading tools that empower you to make smart choices. We covered everything from platform selection and real-time market scanning to advanced charting and effective strategy backtesting. Each tool plays a role in building a robust trading workflow that blends technology with sound risk management. Embrace these insights to stay ahead of market trends and boost the confidence behind your every trade. Happy trading and keep growing your investment skills!
FAQ
What do stock trading tools on Reddit and for beginners offer?
Stock trading tools shared on Reddit and designed for beginners provide access to free platforms, insights, and community advice that help you learn market basics and test strategies with minimal risk.
What free stock trading tools and analysis software are available, and which tool is best?
Free stock trading tools and analysis software include basic charting sites and market scanners. The best option depends on your trading style, goals, and level of experience.
What is TradingView and how does it serve traders?
TradingView is a widely used platform for charting and technical analysis that helps traders visualize market trends, create customized indicators, and share real-time insights with its active community.
How do trading tools and software boost trading decisions?
Trading tools and software, such as scanners and analytic dashboards, help you identify market trends, test strategies, and manage trades, ultimately enhancing your decision-making process with real-time data.
How does Thinkorswim improve the trading experience?
Thinkorswim is a robust trading platform that offers advanced charting, simulation tools, and customizable layouts to help both novice and experienced traders refine their strategies and make well-informed decisions.
Can day trading realistically earn $1000 a day?
Day trading has the potential to earn $1000 a day, but consistent profits require solid strategy, discipline, and careful risk management. Results vary widely among traders.
What does the 3-5-7 rule in trading mean?
The 3-5-7 rule in trading is a guideline that helps balance short-term, medium-term, and long-term signals for entry and exit decisions, aiming to improve overall trade timing and outcomes.
Is starting with $100 enough to begin trading?
Beginning with $100 allows you to learn trading basics and test strategies, but substantial returns typically require more capital and a well-planned risk management approach over time.