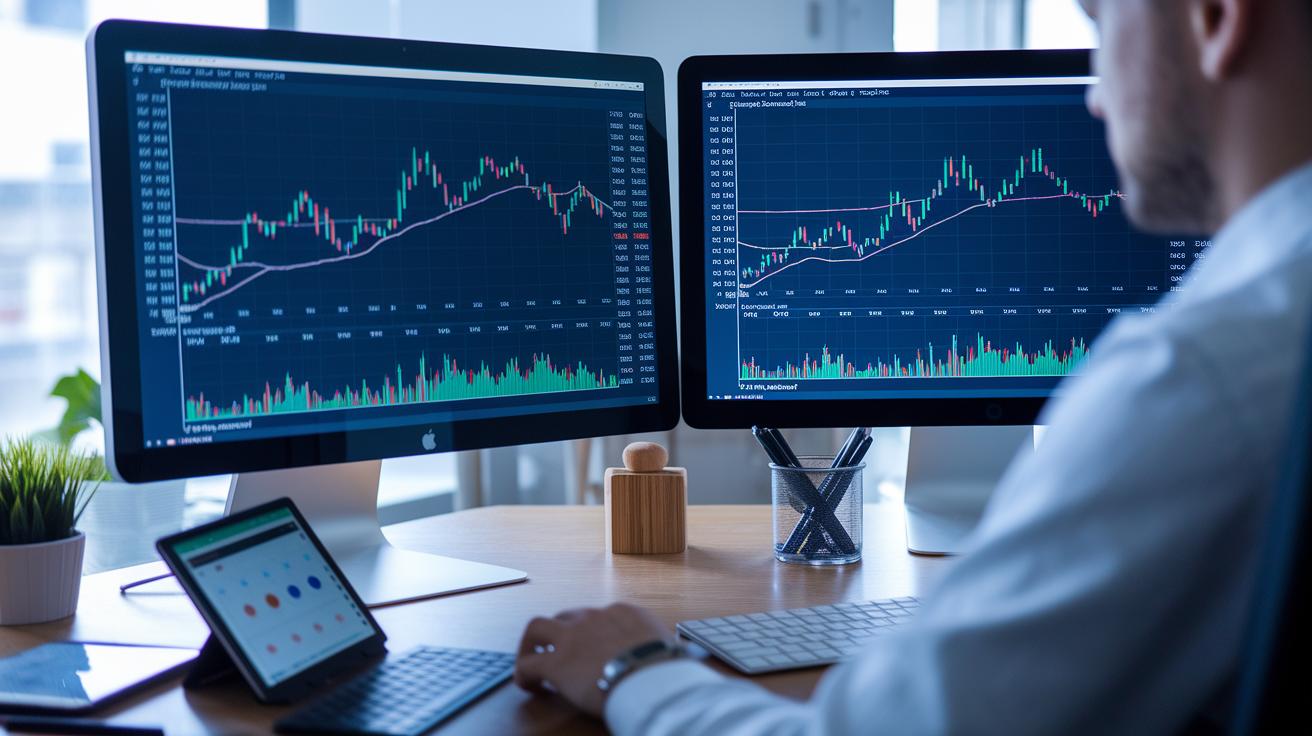
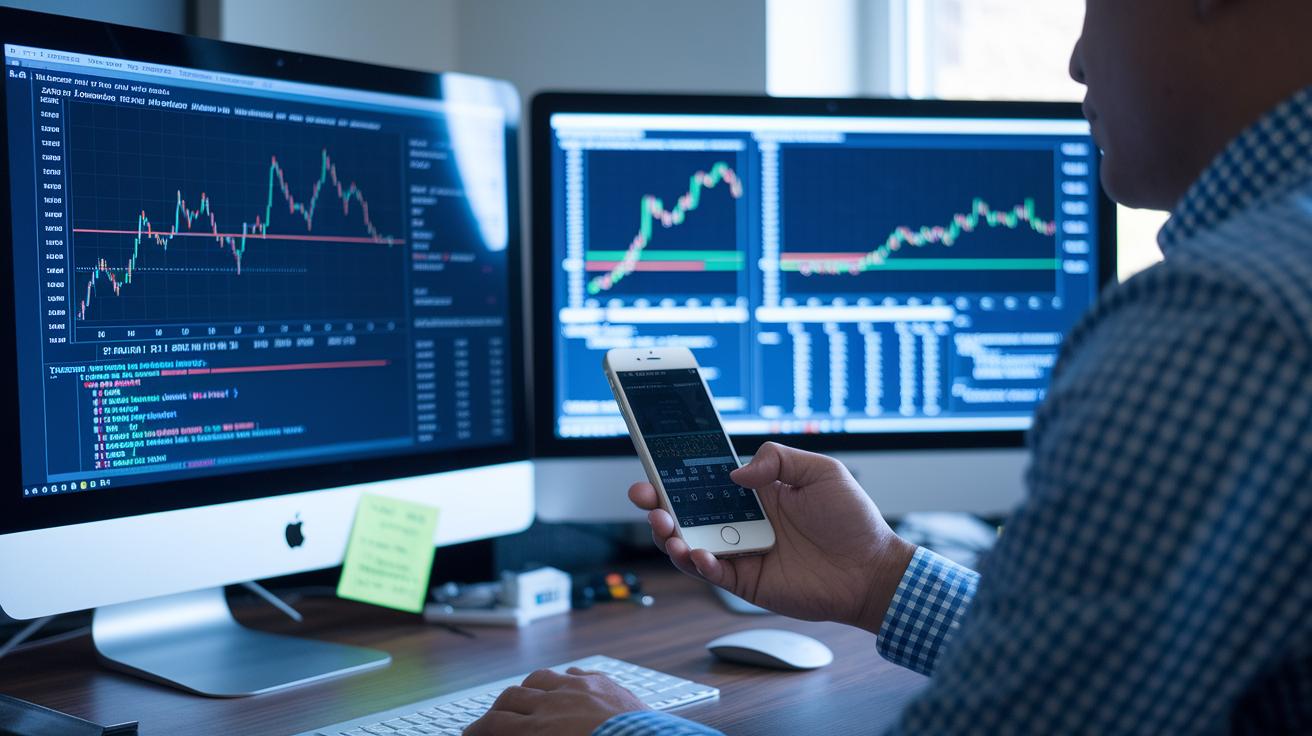
Ever feel like your stock picks might be missing that extra spark? Sometimes, a stock screener loaded with handy technical tools can give your strategy the boost it needs.
Imagine a tool that lays out clear, easy-to-read charts and smoothly sifts through market data. In this conversation, we’ll break down different options and spotlight the ones that bring power and simplicity to your trading. We’re here to help you zero in on the perfect match for your technical analysis, all in a way that feels natural and straightforward.
Best Stock Screeners for Technical Analysis: Top Picks for 2025
If you're looking for screeners that mix clear technical charts with smart trade filters, these tools might be just what you need. They give you everything from simple chart views and performance numbers to the chance to build your very own filters.
| Screener | Key Technical Features | Free or Paid | Unique Advantage |
|---|---|---|---|
| Fidelity | Offers basic charts and performance stats; unlocks advanced sector themes once registered | Free with paid upgrades for extra features | Focus on niche themes like drones, natural foods, and wind energy |
| Finviz | Includes filters for IPO dates and outstanding shares; lets you save preset screens | Free with registration | Powerful filtering even though the interface is a bit busy |
| Yahoo Finance | Clean layout with options for screening sustainable stocks, mutual funds, ETFs, and futures | Free | Balanced tool for screening across several asset types |
| TradingView | Easy on beginners with advanced technical overlays; covers equities, forex, and crypto | Free with paid tiers available | Clear visuals that work great for both newbies and experts |
| StockFetcher | Build your custom filters using over 125 indicators; comes with a detailed user guide | Free, though it has a learning curve | Deep customization with handy filter examples |
| Stock Analysis | Offers tooltips to explain tougher terms; lets free users save their screens | Free with optional Pro upgrade for decade data | Breaks down technical details in an easy-to-understand way |
| Koyfin | Provides over 500 metrics with more than 10 years of history; combines charts with watchlists | Free with premium choices | Features percentile ranking for solid technical and fundamental insight |
Fidelity works best for traders who want quick access to essential info and the chance to upgrade for deeper insights. Finviz and Yahoo Finance are great if you like detailed filters paired with a simple look. And if you’re after a higher level of customization for technical analysis, TradingView, StockFetcher, Stock Analysis, and Koyfin have you covered.
Feature Comparison of Stock Screeners for Technical Analysis

| Feature | Screeners & Key Details | Trading Approach Benefit |
|---|---|---|
| Charting | Fidelity and Yahoo Finance give you basic, quick snapshot charts. TradingView and Koyfin step it up with multi-pane displays for a richer look at the details. | If you like making fast decisions, basic charts are spot on. But if you enjoy digging deep into trends, multi-pane charts can help you spot even the smallest shifts, like noticing a gradual momentum change just before a big market move. |
| Indicators | StockFetcher has more than 125 indicators, Koyfin shows off 500 metrics, and Finviz covers all the usual technical ratios. (Check out more on technical analysis software here: https://nftcellar.net?p=1477.) | Having access to a large library of indicators is like checking off every possible market clue on your list. It’s perfect for traders who value thorough, data-driven analysis. |
| Filters | Finviz lets you filter by details like IPO dates and shares, while Yahoo Finance focuses on sustainable stocks. | Detailed filters are great for zeroing in on the stocks that really match your strategy, whether you’re playing it safe or chasing growth. |
| Customization | Platforms such as StockFetcher allow you to build custom formulas and set up personalized screening rules. | This feature is a big win if you like tailoring your tools exactly to your trading style, sort of like creating a checklist that fits you perfectly. |
| Asset Classes | TradingView expands your search beyond stocks to include global forex and cryptocurrencies. | If you’re interested in multiple markets, this broader approach lets you explore various asset classes without switching tools. |
Choosing the right screener really depends on how you trade. If you prefer making quick calls, sticking with basic charts and focused filters is ideal. But if you’re the type who loves a thorough market dive, then a rich indicator library and the option to customize your setup can give you that extra edge.
Pricing Structures of Technical Stock Screeners
If you're just starting out in trading, there are plenty of no-cost options to explore. For example, Fidelity offers free charting once you create an account, even if accessing advanced themes or expert insights requires a bit more setup. TradingView’s free tier gives you a solid set of technical overlays, and Koyfin supplies core features at no cost. These options are perfect for beginners who need the basics without committing to a subscription.
For traders wanting more detailed data and extra filters, mid-range subscriptions could be the right match. Finviz Elite comes in at about $39.50 a month and provides real-time data along with fast alerts that can help you make quick decisions. Yahoo Finance Premium, priced at $34.99 per month, adds advanced filters and deeper performance metrics. Also, TradingView’s Pro tier at $14.95 a month and StockFetcher’s plans ranging from $14.95 to $24 a month offer extra customization for those who trade more regularly.
For advanced technical analysis, high-end subscriptions bring even more precision. TradingView offers a Pro+ plan at $29.95 and a Premium plan at $59.95 per month, both designed to enhance signal detection and closely monitor asset trends. Stock Analysis Pro is available at $6.58 per month when billed annually, giving you access to extended historical data. Meanwhile, Koyfin’s premium metrics, although priced variably, deliver a robust set of tools for experienced investors.
Usability and Interface in Top Technical Stock Screeners
When you pick a stock screener for technical analysis, having a clean and clear layout is really important. Many traders look for an easy-to-use trading filter that helps spot trends in a flash. A simple design lets you focus on tweaking your technical setups while keeping all the data right in view, sparking fresh insights.
Take Yahoo Finance and Finviz as examples. Yahoo Finance sports a clear layout with an easy filter for trades, making it perfect for anyone who loves a quick, clear glance at market data. On the flip side, Finviz packs powerful features but can feel a bit crowded for newcomers, so it might not spark those insights as naturally.
If you need a little extra help, platforms like StockFetcher offer a detailed User Guide that walks you through the features and shows examples to tailor your setup. And with Stock Analysis, you get handy tooltips that break down technical terms, so even beginners can navigate with confidence.
Advanced users will find TradingView and Koyfin appealing. TradingView’s simple, default interface gives you quick access to key technical overlays, covering things like forex and crypto, that ignite useful insights. Meanwhile, Koyfin’s data-rich dashboard is built for experienced traders with detailed visuals and customizable filters that make trading even more straightforward.
Data Coverage and Real-Time Performance of Technical Screeners
Staying on top of market moves means you need real-time data. TradingView and Yahoo Finance update throughout the day, keeping you in tune with the fast-paced flow of trends. But platforms like Finviz might update a bit slower, and StockFetcher can lag just a bit when it comes to near-live market snapshots. These small delays can really affect your ability to catch quick momentum shifts.
A solid historical archive is just as important. Take Koyfin, for example, it gives you averages over 3, 5, and 10 years, offering a clear, long-term view of performance trends. Then there’s Stock Analysis Pro, which lets you tap into a full decade of data. This blend of past performance with today’s market vibes helps you compare current signals against tried-and-true benchmarks, refining your strategies along the way.
And precision in performance metrics? That makes a big difference. Koyfin’s use of percentile rankings means you get a clear, scalable view of how a stock fares compared to its history, or even relative to its industry or region. Tools like these are super valuable for traders looking to evaluate market momentum and make quick, informed decisions during those volatile periods.
Strategy Backtesting and Customized Formulas in Stock Screeners
Strategy backtesting lets you test your trading ideas using past market data. It shows how your rules might have worked out before, so you can tweak your tactics and feel more confident when trading in real time. It’s a great way to spot patterns over months or even years, making it easier to adjust your strategy.
Customized formulas take things a step further by letting you build your own screening rules. Many platforms let you use custom expressions, so you can set up filters that match your unique trading style. This means you can automatically pick up trends and fine-tune signals instead of relying on generic setups, turning your system into a personal market evaluator.
Some platforms, like StockFetcher, let you build filter scripts with over 125 indicators. Others, like Koyfin, use percentile calculations to compare today’s figures with historical benchmarks. With these custom formulas, you can even spot chart patterns (technical analysis chart patterns – https://nftcellar.net?p=1394) that might otherwise go unnoticed, transforming raw data into insights you can really use.
When trying this out, test your rules under different market conditions and adjust based on how they perform. Start small with a few key indicators, then gradually add more as your confidence grows. This step-by-step method can help sharpen your trade timing and refine your signals for smarter decisions.
Selecting Your Ideal Stock Screener for Technical Analysis
If you’re picking a stock screener for technical analysis, start by checking out its main features and how easy it is to use. Look for a tool that helps you set things up quickly or one that lets you adjust settings for your unique strategy. Think about what assets matter most to you. For instance, if you mainly focus on stocks, make sure the screener covers that well. But if you like a variety, it should handle other types of assets too.
Tailor your choice to your trading style. If you’re just starting out, a simple design with the basic filters might be perfect. If you’re more experienced, you may want advanced charting options and the ability to create custom formulas that help you pick up on market trends. Have you ever felt the thrill of spotting the right moment based on a well-built chart? Check out more details here: https://tradewiselly.com?p=3318.
Budget is another key factor. Compare free options with paid ones by looking at what each offers. Sometimes, the free version is enough, but paying for extra features might give you richer market data that can boost your decisions.
Lastly, make sure your screener works smoothly with other tools you use, like charting apps, watchlists, or earnings calendars. Good integration helps keep your trading strategy organized every day and supports your long-term goals.
Final Words
In the action, we explored top stock screeners covering technical chart tools, pricing structures, user-friendly interfaces, and deep data coverage. We broke down key aspects like filtering options, backtesting, and real-time performance.
These insights show how aligning features with your trading style can make a difference. Each tool offers unique benefits, from clear layouts to comprehensive historical data. Choosing the best stock screener for technical analysis helps you manage risk and stay ahead of trends with confidence and ease.
FAQ
What is the best stock screener for technical analysis recommended on Reddit?
The recommendation on Reddit often highlights screeners like TradingView and Finviz for their rich data overlays and technical indicators, making them popular choices for deep technical analysis.
What is the best free stock screener for technical analysis?
The best free stock screeners for technical analysis are platforms such as Yahoo Finance and TradingView, which offer clear interfaces and essential charting without charging fees.
What is the best stock screener for technical analysis on the NSE?
For NSE traders, screeners that include regional market data and technical overlays, like TradingView with customizable feeds, tend to be the preferred choice for local technical insights.
What is the best free stock screener for day trading?
The ideal free stock screener for day trading is one that delivers real-time data and swift filtering, with platforms like TradingView and Yahoo Finance enabling rapid decision-making.
What is the best stock screener for day trading overall?
Robust screeners like Finviz Elite and TradingView combine real-time charts and advanced technical filters, offering the quick insights needed to support active day-trading strategies.
What is the best stock screener for swing trading?
Swing traders benefit from screeners such as TradingView that feature advanced technical overlays and pattern recognition, helping identify medium-term trends efficiently.
What is the best stock screener for scalping?
Scalpers require screeners with minimal delays and rapid data updates; platforms like TradingView provide the real-time performance and precise technical details necessary for quick trades.