Have you ever thought that a simple candle might show you the best time to trade? Candlestick charts have been a trusted tool since old Japan, when they were first used to track rice prices. They give clear clues, like a tiny lamp in the night, signaling when the market might change. This helps you spot the moments when buyers step in and sellers drive prices down. In this blog, we’ll explain how these easy-to-read patterns can help turn everyday trading into smart, well-timed moves.
Candlestick Chart Pattern: Smart Trading Signals
Candlestick charts have been around for over a century. They started in Japan when traders tracked rice prices, turning each price change into a visual snapshot of market emotions. Imagine a trader jotting down every price move on paper, capturing his excitement, worry, or calm in the shape of each candle.
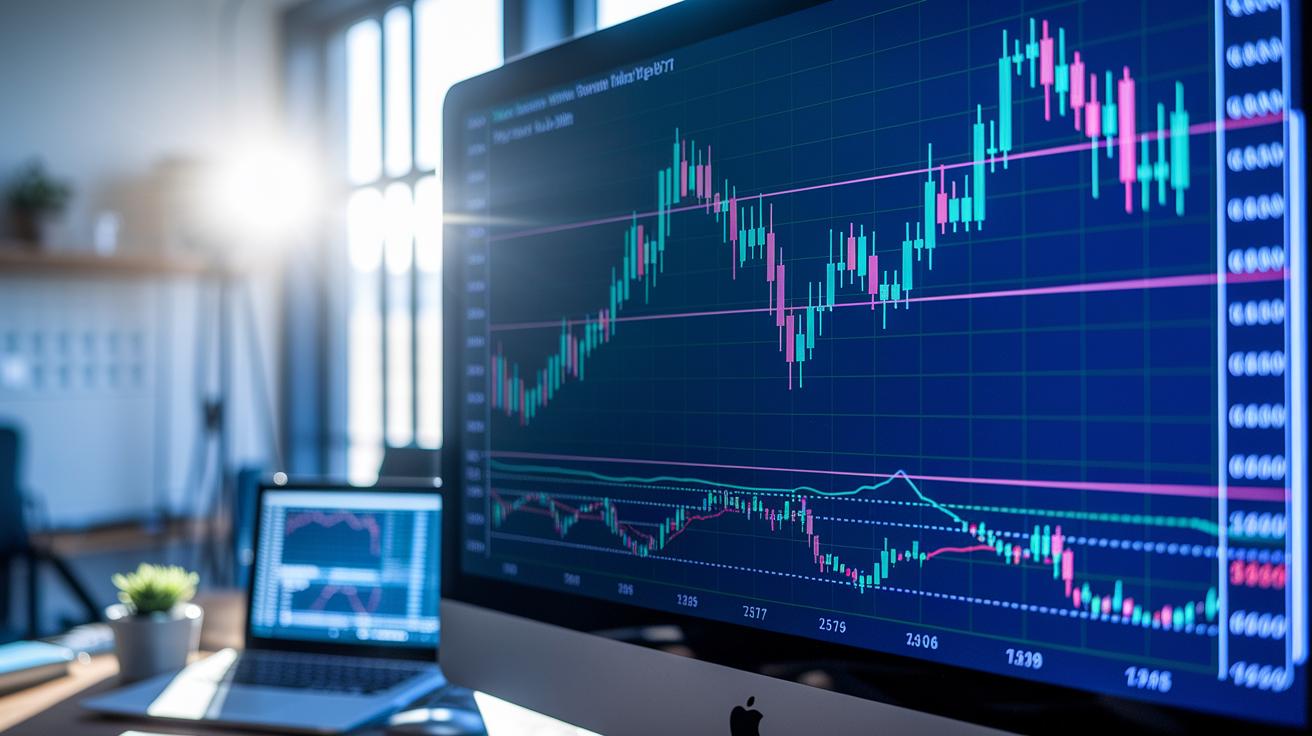
Each candlestick shows two main parts: the body and the shadows. The body, which sits between the opening and closing prices, tells you how strong the price movement was during that period. Meanwhile, the upper and lower shadows show the highest and lowest prices reached. Usually, a green or white body means prices went up, while a red or black one signals a drop. This simple design helps traders quickly see whether buyers or sellers had control.
Today, candlestick charts are still a key tool in technical analysis. They act like an X-ray into the market’s pulse, letting you spot when buyers start to outnumber sellers, or vice versa. By mixing these clear signals with broader market strategies, traders can build strategies based on a sound understanding of how the market really moves.
Key Bullish and Bearish Candlestick Reversal Patterns
Reversal patterns are important because they can hint that the market may change its course. Traders keep an eye on these signals as a way to spot when buyers and sellers switch roles. Spotting patterns like the hammer or bullish engulfing can give you early clues that the current trend might be ending. This extra insight helps you adjust your trading plan and keep risks in check.
| Pattern | Formation Characteristics | Market Context |
|---|---|---|
| Hammer / Inverted Hammer | A small bar near the top with a long lower shadow after a downtrend | Hints at a possible upward turn after falling prices |
| Bullish Engulfing | The new candle completely covers the previous candle’s body | Shows strong upward movement in a downtrend market |
| Morning Star | A set of three candles: a bearish candle, a small middle candle, and then a bullish candle | Signals a potential switch from a downward to an upward trend |
| Hanging Man | A small top body with a long lower shadow forming after an upward trend | Suggests a possible downturn when the market is peaking |
| Doji | A candle with very little body and nearly the same open and close | Reflects market uncertainty that might turn into a reversal |
| Spinning Top | A small candle with similar-length upper and lower shadows | Indicates hesitance among traders, often before a big move |
Even though these patterns offer good hints about where the market might go next, it's smart to confirm them with other tools. You might check trading volume, draw trend lines, or use indicators like oscillators. For example, if you spot a bullish engulfing pattern and see a bump in trading volume, that extra detail makes the signal more trustworthy when you decide to make a move.
Multi-Timeframe and Volume Considerations for Candlestick Patterns
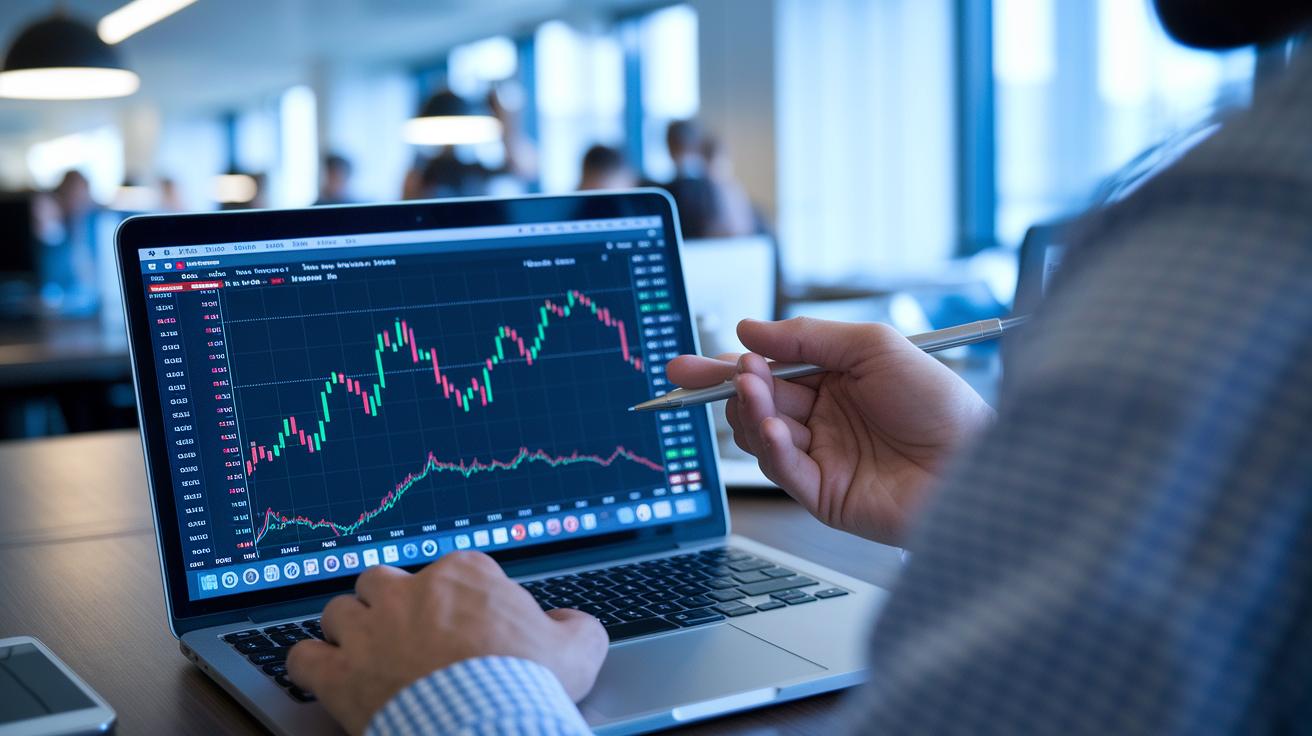
When you check candlestick patterns on different timeframes, you get a better feel for the market’s overall mood. Daily charts help smooth out the ups and downs you see on hourly or minute-by-minute charts. By looking at a pattern on more than one chart length, you can feel more sure that the signal is real. For example, if you see a pattern on a daily chart and then spot it again on a 15-minute chart, you’re getting a clearer picture of the trend.
The volume, or how many trades happen during the pattern, also plays a big role. A sharp increase in trading volume tells you that a lot of traders are backing the move, which adds trust to the signal. On the flip side, if the pattern shows up with low volume, it could just be a false alarm. Also, patterns near key support or resistance levels tend to be stronger because those spots often see a lot of trading interest and strong price actions.
Integrating Candlestick Patterns into Risk Management and Trading Strategies
Sometimes a single candlestick pattern can be a bit misleading. Traders often place a stop-loss order just beyond the outer edge of the pattern, aiming for a risk-reward setup where the potential gain is at least twice the possible loss. They back up the candlestick with extra technical hints like trend lines, moving averages, or oscillators (tools that help you see how the market might move). For example, if you spot a hammer pattern on a 15-minute chart, you might set your stop just below it. This gives you a safety net while leaving room for the price to bounce back.
Candlestick signals also help guide your entry and exit moves, whether you’re trading over a few days or just within the day. Many traders verify these patterns by checking the trading volume and the overall trend before making their move. A simple checklist that looks at the pattern’s shape, the volume, the time frame, and the market trend can be a real game changer. It helps you decide clearly when to take profits and when to cut your losses. This methodical approach builds confidence and keeps your trade planning clear and effective.
Advanced Analysis and Automated Detection of Candlestick Patterns
Research on markets in places like Taiwan and Japan shows that mixing numbers with traditional candlestick methods improves our trading signals. Experts found that looking at past performance helps score how reliable a candlestick pattern is. Think of it as checking the weather forecast, it’s not just about the temperature; you also consider humidity and wind for a fuller picture of what’s ahead.
Today’s smart algorithms scan live market feeds and quickly spot common patterns like hammers, engulfing moves, and stars across different chart times. These systems work hand-in-hand with entry strategy models to let you know when a high-chance setup is on the horizon. This way, you don’t have to manually dig through charts, and you can feel more confident acting on a signal. Plus, these tools can be paired with other checks, like comparing multiple time frames, to ensure you’re trading based on solid, real-time insights.
Final Words
In the action, we explored the basics of candlestick chart pattern formation and how their shapes and colors can reveal market moves. We talked through reversal signals, multi-timeframe checks, volume boosts, and how to add these insights to your risk management tactics.
The guide also looked at advanced methods like automated detection, giving you clear steps to spot opportunities early. Stay confident and let these strategies help you trade smartly with every candlestick chart pattern move.
FAQ
What does a candlestick chart pattern book offer?
The candlestick chart pattern book explains how Japanese candlesticks show market moves. It highlights the key patterns that reveal shifts in buying and selling, providing a practical guide for traders at any level.
What do candlestick chart pattern PDFs, including free downloads and collections like the 35 or 75 powerful patterns, provide?
The candlestick chart pattern PDFs offer comprehensive digital guides with detailed visual examples of market signals. They serve as handy references for traders looking to learn or review key candlestick formations.
What are bullish and bearish candlestick patterns?
Bullish candlestick patterns indicate rising prices and buying pressure, while bearish candlestick patterns signal falling prices and selling pressure. These patterns help traders identify market shifts at a glance.
How do candlestick patterns benefit beginners?
Candlestick patterns for beginners simplify market insights by clearly displaying open, high, low, and close prices. This visual format makes it easier to understand price movements and learn basic trading tactics.
Which is the best candlestick pattern?
The best candlestick pattern varies with market conditions and individual trading styles. Successful traders look at patterns in context, often confirming signals with volume or trend indicators for greater reliability.
What is the 5 candle rule?
The 5 candle rule uses five consecutive candles to confirm a trend change. It helps traders judge momentum shifts by analyzing a sequence of price movements, though it works best when used with additional confirmation tools.
What is the 3 candle rule?
The 3 candle rule involves watching three sequential candles to spot possible reversals or continuations. It offers a quick gauge of trend strength, but combining it with other signals can improve its accuracy.
How do I read a candlestick chart?
Reading a candlestick chart means identifying each candle’s open, high, low, and close values. This clear layout provides a snapshot of market sentiment and price shifts, essential for making informed trading decisions.