Tired of the same boring trading screens that everyone else uses? Imagine having your own dashboard that fits your style perfectly, letting you switch views with just a tap. With customizable charting software, you can control every little detail of your market display. It’s like building your very own control room where technical signals (data that shows market trends) and live data come together in real time. This smart setup gives you clearer insights into how assets move and helps you understand risk, making your analysis sharper than ever.
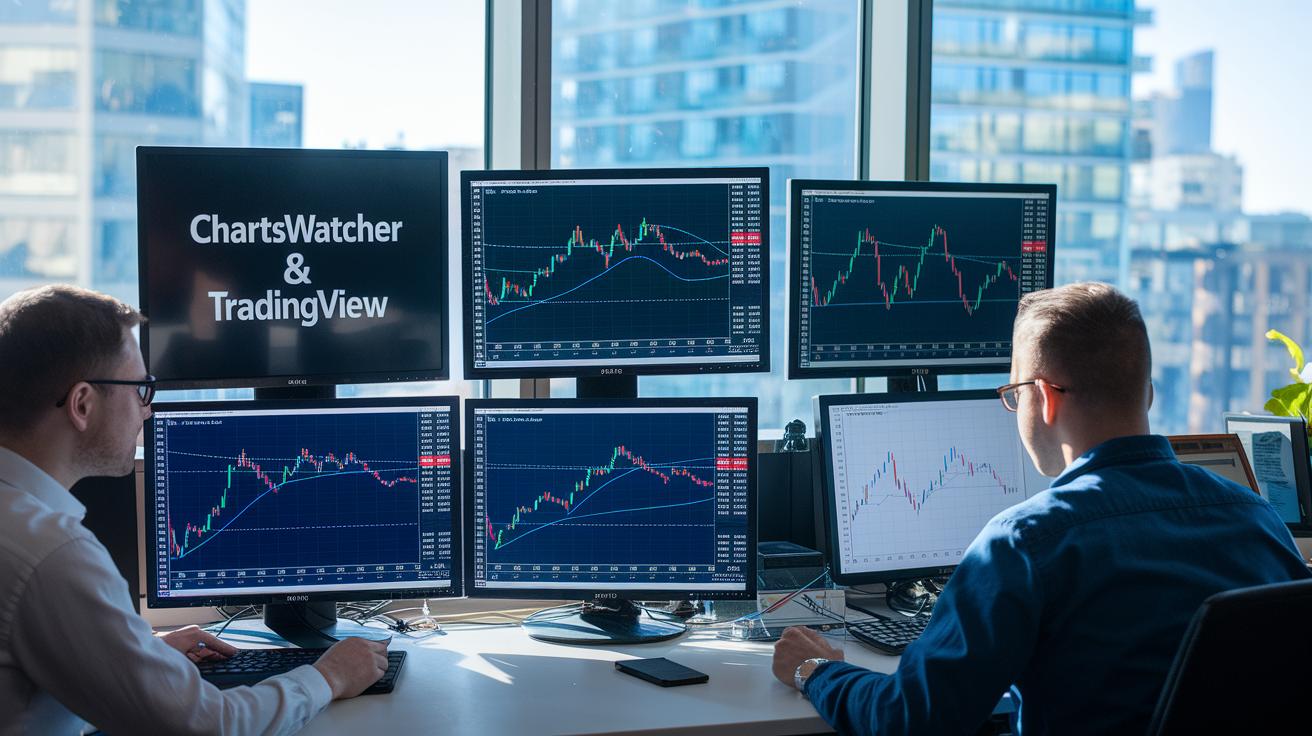
Customizable Charting Software: Core Features for Investment Analysis
Modern investors need charting tools that work just the way they do. These platforms let you shape your dashboard and customize data views so you can keep up with sudden market moves. Imagine setting up several screens at once, one to check technical signals, another to track alerts, and yet another for top market lists. It’s like arranging a control center that fits your style perfectly.
These systems mix live data charts with interactive visuals, giving you a clear picture when the market heats up. Whether you’re fine-tuning backtesting routines or switching up multi-chart layouts, every tweak helps you better analyze asset performance and risk. It’s all about having control over how you see the market, which makes understanding trends easier and more efficient.
| Platform | Customization Capacity | Key Feature |
|---|---|---|
| ChartsWatcher | Up to 20 personalized screens with eight window types | Free plan plus paid options unlocking backtesting and expanded dashboards |
| TradingView | 100+ technical indicators and multi-chart layouts | Free basics with upgraded tiers offering advanced community features |
| MultiCharts | Advanced charting with PowerLanguage scripting | Lifetime licenses with backtesting and automated trading |
| Eikon | Real-time data integration across multiple asset classes | Seamless Excel integration for detailed analytics |
| TrendSpider | AI-powered multi-timeframe visualization | Automated trendline and pattern detection |
With these flexible features at your fingertips, spotting market trends becomes more natural. Mixing interactive charts with live update tools lets you catch opportunities fast and adjust your plans on the run. It’s a smooth, straightforward way to stay one step ahead in today’s busy market.
Personalizing Your Investment Charts with Adaptive Dashboard Design

Dynamic Screen Management
Imagine being able to grab a module with your mouse and simply move it around on your screen. Modern platforms make this possible with an easy drag-and-drop setup, letting you shift and resize parts of your work area in a multi-screen environment. You can even create your very own workspace templates so that every time you log in, your screens look exactly how you want them. Fun fact: ChartsWatcher offers eight different window types, allowing you to craft and save layouts that match your unique trading style in real time.
Customizable Panels & Templates
Picture building your dashboard like assembling a puzzle. With preset panels that include design templates, chart types, alerts, and watchlists, you can mix and match everything to create a personal visual library. Tools like detachable chart tabs and custom widget panels help you keep everything neat and synced across your devices. It’s like putting together a visual puzzle where every piece fits perfectly to highlight your strategy.
Save & Share Layouts
Once you’ve set up the perfect dashboard, you can save it and use it on any device you own. This feature also makes it simple to share your custom layout with your team, ensuring everyone sees the same clear, consistent design. For example, a trader can share a dashboard that automatically syncs across all devices, keeping the whole team in tune with the latest insights.
Integrating Real-Time Market Data with Custom Charting Tools
Imagine trying to catch a bus that leaves before you even get to the stop. That’s what real-time market data can feel like. When prices shift in the blink of an eye, having live data isn't just nice, it’s essential. Think about watching graphs that update right before your eyes, signaling every little move. It’s like feeling the steady pulse of the market, ensuring you never miss a chance when it matters most.
Consider tools like TradingView and Eikon, they’re built to make your trading experience smoother. TradingView offers live quotes for stocks, forex, and crypto, and even lets you place orders directly through your broker. It’s like having a one-stop shop for all your trading needs. Eikon, meanwhile, sends live updates for stocks, bonds, futures, and currencies, plus it has an Excel API for custom queries. This lets you mix data from different sources into one personal dashboard that’s as unique as your trading style.
Now, for those who need to act fast, low latency is as vital as accuracy. For example, Interactive Brokers TWS gives quick access to data from 160 markets in 36 countries. That means every piece of information is delivered in a flash, helping you make those critical decisions without delay. It’s all about finding that perfect balance between speed and reliability, so you can trade confidently no matter how global your portfolio may be.
Advanced Trend Modeling & Dynamic Pattern Detection for Investors

AI-powered trend modeling is changing the way you analyze market trends. Instead of spending hours staring at charts, smart tools do the heavy lifting for you. For example, TrendSpider uses clever algorithms to spot trendlines, Fibonacci retracements (simple signals for potential turning points), and candlestick patterns across different time spans.
This kind of AI work not only saves you time, but it also boosts your ability to catch market reversals and confirm when trends keep going. Imagine your software automatically sketching trendlines on your charts like an artist outlining a landscape, it makes knowing when to act much easier.
Scriptable indicators add a whole extra layer of support too. They let you build your own custom algorithms that adjust as the market shifts. MultiCharts gives you the power to code your own strategies, while ProRealTime offers tools for setting up automated trades and custom alerts. It’s like having a personal trading toolbox that grows with you.
Together, these tools provide a neat mix of automation and personalization. They make your charts not only look good but also reveal deep insights through smart pattern detection. This blend of AI and custom scripts is a real game-changer, giving you powerful and flexible tools to navigate the market.
- Automated trendline drawing
- Alerts covering multiple timeframes
- Custom scripts you can backtest with past data
- AI-driven signal generation
- Fully customizable indicator sets
Comparing Leading Customizable Charting Platforms for Investments
Koyfin offers a wide range of asset classes and lets you adjust indicators exactly how you like them. You can change gridline settings and even apply data tweaks like growth rates and cumulative return. It’s perfect if you love comparing several investments in detail, but if you're new to market analysis, the many options might feel a bit too much.
YCharts comes with a lively visualization dashboard paired with strong basic and technical tools. It’s aimed at advisors and asset managers who need deep market data and sharp analytics. If you’re a professional, you might love the detailed views it provides. But for individual investors, its pricing and focus on professional needs could seem a little too specialized.
StockCharts is known for its flexible technical analysis, offering chart types like candlestick, line, and bar. With plenty of drawing tools and historical backtesting data, it’s a solid choice for active traders who rely on technical study. However, if you’re searching for deeper fundamental insights, you might find its focus a bit narrow.
Finviz mixes screeners and heatmaps into a user-friendly chart builder. Its free version gives you the basics, and upgrading to the Elite plan delivers full-screen charts and real-time data. This setup can be great for retail traders who enjoy quick visual insights, though advanced users might wish for even more detailed customization.
Finchat blends AI with fundamental charting on a simple, easy-to-use platform. It’s ideal if you like automated data insights, but it has some limits, like not supporting every asset type and using day-delayed pricing. This could be a drawback if you need the very latest information.
In the end, the best platform depends on your trading style and goals. Advisors and asset managers might lean toward YCharts for its robust tools. Retail traders could prefer the quick, technical focus of StockCharts or Finviz, while those who need plenty of customization may find Koyfin most fitting. And if you’re curious about AI-enhanced insights, Finchat might be the one, just keep its limitations in mind.
Pricing Plans, Trial Options & User Feedback on Customizable Charting Software
Many trading platforms offer different entry levels so you can find one that fits your style and budget. For instance, ChartsWatcher gives you a free version with a few dashboards and offers paid upgrades for backtesting and extra screens. Note that VAT charges might vary based on where you live.
TradingView is popular for its variety. You can start for free with the basic plan, and if you need more, you have the Pro plan for $14.95 per month, Pro+ for $29.95, and Premium at $59.95. These plans not only allow higher limits for technical indicators but also bring extra community features into play.
Then there’s MultiCharts, which works on a one-time license fee ranging from $597 to $1,497. It also has optional fees for data feeds depending on the provider you choose. And if you need something on an enterprise level, Eikon offers a subscription that starts close to $22,000 per year. Lastly, StockCharts gives a basic membership for free and has additional tiers – the Extra at $14.95, Pro at $24.95, and Platinum at $39.95 – that provide real-time scans and wider market coverage.
User reviews show practical benefits like easy-to-access free trials and pricing plans designed to grow with your needs. Many users mention how straightforward TradingView and StockCharts are with their tiered options and community features, which work well for both beginners and experienced traders. Some appreciate that MultiCharts only needs a one-time payment even if extra fees might pile up, while Eikon’s high cost is seen as valuable for professionals despite being a bit steep for smaller traders.
| Platform | Pricing Option |
|---|---|
| ChartsWatcher | Free tier + paid upgrades (VAT varies) |
| TradingView | Free, Pro ($14.95/mo), Pro+ ($29.95/mo), Premium ($59.95/mo) |
| MultiCharts | One-time fee ($597 – $1,497) + optional data-feed fees |
| Eikon | Enterprise subscription (starting near $22,000/year) |
| StockCharts | Free basic membership, Extra ($14.95), Pro ($24.95), Platinum ($39.95) |
Final Words
In the action of our discussion, we brushed through key features of dynamic charting solutions. We looked at customizable dashboards, live data feeds, advanced trend models, and clear pricing plans that empower investors.
Our talk emphasized how smart charting techniques can simplify market insights while managing risk effectively. Embrace these tools and enjoy the clarity they offer in your investment decisions with customizable charting software for investments.
FAQ
What is the best free customizable charting software for investments?
The best free customizable charting software for investments typically features interactive visuals, real-time indicators, and flexible layouts. It lets you analyze market trends and tailor charts to your trading strategy.
What is the best charting software for stocks?
The best stock charting software delivers a clear view of market trends with features like real-time updates and varied technical indicators. It helps you track price changes and make informed trade decisions.
What charts do investors use?
Investors commonly use candlestick, line, and bar charts. These charts help plot price trends and trading volumes, making it easier to spot patterns and adjust investment strategies.
How do you make an investment chart?
Making an investment chart involves choosing a chart type, adding historical market data, and overlaying technical indicators. This process visually represents price movements and market trends.
Can I make my own trading software?
You can create your own trading software using open-source tools and APIs to build interactive charts. It requires coding skills and access to reliable market data to produce a custom analysis tool.
Is NinjaTrader available as a free download?
NinjaTrader offers a free version with essential trading and charting tools. Upgrading to access advanced features involves discounted licensing, making it a practical option for many traders.
How can I learn stock chart analysis?
Learning stock chart analysis starts by studying basic chart types and technical indicators. Practice on free, interactive platforms to build confidence in identifying market patterns and making smarter trading decisions.
What is the best charting software for day trading?
The best charting software for day trading provides live updates, low latency, and a suite of technical tools to capture fast price movements. This helps you make timely decisions in rapidly shifting markets.