Have you ever wondered if every dollar you put into stocks could work even harder for you? Dividend yield analysis can show you just that by telling you how much cash you make from your investment. Think of it like checking the balance on a scale, it gives you a clear picture of a stock's income potential. Today, we'll break down how to calculate and understand dividend yields so you can spot steady returns and feel confident about making smart money moves.
Dividend Yield Analysis Sparks Smart Investment Choices
When we talk about dividend yield analysis, we're looking at how much cash you get back for every dollar you invest in a stock. You do this by dividing the annual dividend per share by the stock's current price. For example, if a company pays $5 each year for every share and the share costs $100, you get a 5% yield. That means you earn about 5 cents for every dollar invested.
This easy formula gives you a clear look at a stock's income potential and helps you compare similar companies. Remember, if the share price goes up without the dividend going up too, the yield will drop. It's like balancing a scale, if one side gets heavier, the balance shifts.
Here's another way to see it: imagine a company that pays a $3 dividend annually while its share price is $60. The yield is calculated as 3 divided by 60, which gives you a 5% yield. In simple terms, for every dollar you invest, you get 5 cents in dividend income.
Understanding this dividend ratio is a great way to check a company's income stability and overall financial health. It can really help guide you toward smarter investment choices by showing you the steady cash return you might expect from each dollar you put in.
Methods for Calculating Dividend Yield

Ever wondered how to see the cash you might earn back on your investment? One easy way is to add up all the dividends paid over the last 12 months and then divide that sum by the stock’s current price. For example, if a stock closed at $63.61 on December 31, 2022, and it paid $3.18 in dividends during the past year, you simply divide 3.18 by 63.61. This calculation shows you the cash return based on what happened in the past.
Trailing Dividend Yield Calculation
This method looks strictly at past performance. It sums up the dividends paid in the previous 12 months and then uses today’s share price to calculate the yield. Think of it as a snapshot of what the company has given out recently. For example, if a company that used to pay no dividends suddenly reported an annual total of $3.18 on a share price of $63.61, the yield would be about 5%. It’s a simple way to gauge the company’s past stability and performance.
Forward Dividend Yield Calculation
Forward dividend yield, on the other hand, is all about looking ahead. Instead of using historical dividends, it estimates what you might expect in the next year. You take the forecasted dividend for the upcoming 12 months and divide it by the current share price. This technique is helpful if analysts expect a higher payout next year and can give you a good feel for potential changes in your cash income.
Interpreting Dividend Yield Analysis Results
When you're checking out dividend yields, a super high yield might catch your eye, but it can also signal extra risk. For example, if a company’s finances start to slip, those big dividends might not be able to stick around, which could lead to cuts down the line. On the other hand, lower yields often mean the business is reinvesting its money to grow, something you usually see with rapidly expanding firms.
It's a good idea to compare the yield numbers with how much of the earnings are actually paid out as dividends. By doing that, you can get a clearer picture of whether the numbers are sustainable. Remember that the size of the company and its industry trends matter a lot too. Smaller companies might offer higher yields, but they also come with a bit more uncertainty. Meanwhile, certain industries tend to have a steadier stream of cash, making their dividend payouts more reliable.
Also, consider looking at the dividend growth rate along with how solid a company’s balance sheet is. This mix of factors helps you balance the promise of steady income against the risk of unpredictable payouts, so you can build a portfolio that includes both income and growth opportunities. Have you noticed any unexpected shifts in dividend trends lately? It might be time to dig a little deeper.
Historical Dividend Yield Trends and Sector Comparisons
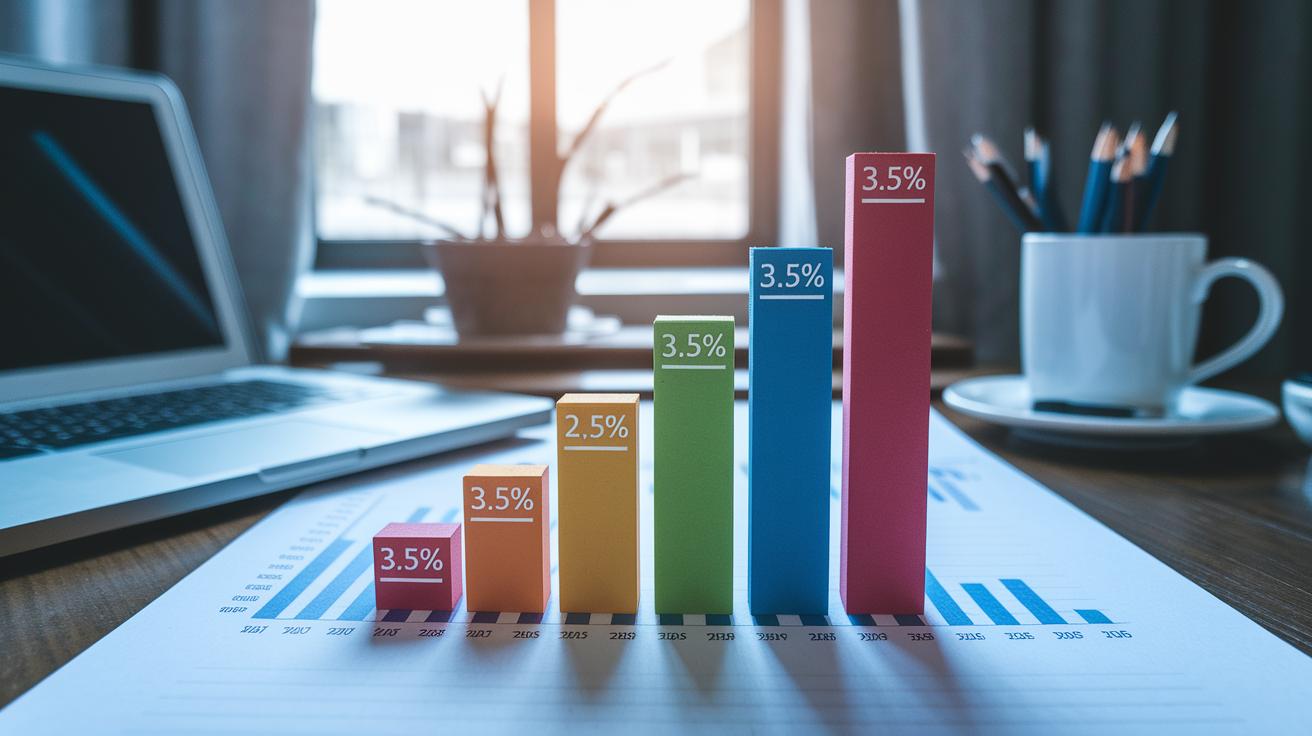
When you look at past dividend yields, you're really seeing how reliably a company has rewarded its investors over time. A steady or growing yield often means you can count on those dividend payments. Think of it like a well-tuned engine that keeps chugging along smoothly, much like a utility company that consistently posts about a 3.5% yield.
Different industries have their own stories to tell. Utilities, for example, often deliver higher yields, around 3.5%, because they benefit from steady cash flow. Companies that provide products you buy every day, known as consumer staples, usually hold around a 2.5% yield. Financial firms tend to come in around 2.8%, balancing growth with steady dividends. Technology companies, which put most of their money into growing their business, might only offer about a 1.2% yield. And industrial firms, striving for a balance between reinvestment and payouts, typically offer close to a 2.3% yield.
These trends come from how stable a company’s cash flow is and the rules they follow. Companies with steady cash flows can often dole out dividends consistently, which builds trust with investors. Meanwhile, businesses that focus on rapid change or heavy reinvestment might show lower yields as they work on expanding their reach.
| Sector | Average Historical Yield | Yield Trend |
|---|---|---|
| Utilities | ~3.5% | Steady/Rising |
| Consumer Staples | ~2.5% | Steady |
| Financials | ~2.8% | Variable |
| Technology | ~1.2% | Low/Stable |
| Industrials | ~2.3% | Steady to Slightly Rising |
Taking a closer look at these patterns can help you spot both opportunities and potential challenges in the market. Does one sector's history catch your eye as a solid bet for steady income?
Incorporating Dividend Yield Analysis into Investment Strategy
When you’re building an income portfolio, many investors start by hunting for stocks that hit a target dividend yield. This little check helps you focus on companies that pay steady dividends, guiding you toward dependable cash returns. For example, if a stock consistently gives back about 5% each year, it can be a solid pick for your income plan.
Investors use dividend yield as just one of the tools to decide how much weight a stock should have in their portfolio. Adjusting positions based on this yield helps make sure every holding boosts your income while keeping risk in check. It’s a lot like putting together your favorite recipe – every ingredient matters in creating a balanced, satisfying result.
- Check how a company’s dividend yield stacks up against its peers.
- Use yield risk analysis to spot stocks that might reduce dividends when market pressures rise.
- Periodically rebalance your portfolio to keep your income on track.
By regularly comparing yields with sector averages and doing a quick check on sustainability, you can uncover hidden opportunities. Think of it like keeping an eye on your car’s performance – catching a small hiccup early means you can fix it before it turns into a big problem.
Analytical Tools and Models for Enhanced Dividend Yield Analysis

Imagine trying to predict the income you might earn from dividends. Yield estimation models help you do just that, they let investors sift through past dividend payouts and future growth guesses to come up with a clear idea of what the returns could look like. You might even set up a simple spreadsheet, piecing together bits of historical data and future projections like a puzzle to see the full picture.
A solid dividend analysis approach goes a step further by mixing yield numbers with figures like payout ratios and cash flow metrics. In other words, it not only shows the potential income but also hints at how reliable those dividend payments might be down the road. Today, many investors also use handy online tools, like investment benchmark comparison platforms, to see how their yields measure up against others.
And then there are real-time monitoring tools. These smart platforms track price changes as they happen and update the yield figures automatically. With these dynamic systems, you get timely insights that help you adjust your strategy on the fly as market conditions shift.
Final Words
In the action, dividend yield analysis was broken down into clear steps. We saw how trailing and forward yields are calculated and interpreted, compared yields across sectors, and examined historical trends. The blog post explained these concepts simply while linking them to risk management and investment strategy. It also highlighted practical tools and models to measure cash returns. This straightforward approach helps you build a smarter portfolio with dividend yield analysis guiding your decisions for a more secure financial future.
FAQ
What is the dividend yield analysis formula?
The dividend yield analysis formula shows that you divide a company’s annual dividend per share by its current share price to find the cash return per invested dollar.
How does the dividend yield calculator work?
The dividend yield calculator works by taking the company’s total annual dividends and dividing them by the current share price, then converting that ratio into a percentage for quick comparison.
What does the dividend yield ratio indicate?
The dividend yield ratio indicates how much cash dividend you earn on each dollar invested, serving as a straightforward measure of a stock’s income-generating potential.
What is a good dividend yield?
A good dividend yield depends on the sector and market conditions; for example, utilities may average around 3.5%, while technology firms might offer closer to 1.2%, making context key for evaluation.
How can I analyze dividend yield effectively?
Analyzing dividend yield effectively means comparing trailing figures (past dividends) with forward estimates, checking payout ratios, and reviewing a company’s financial strength to ensure sustainability.
What is the 5% dividend rule?
The 5% dividend rule means that for every $1 invested, you receive 5 cents in annual dividends, providing a simple benchmark to assess whether the yield seems attractive.
How much must I invest to make $1000 a month in dividends?
To make $1000 a month, you’d need to generate approximately $12,000 in annual dividends, which depends on the yield percentage; higher yields require less capital and vice versa.