Have you ever thought that the euro-dollar pair might give your trading confidence a boost? Lately, we’re seeing strong moves that suggest there’s room for more gains. Simple tools like the RSI (which helps you see if prices are too high or too low) and the MACD (a tool that follows shifts in market momentum) are giving clear hints. With key price levels in play, these clues can help you set up trades that feel both careful and bold. Have a look and see how this analysis might shape your next trade.
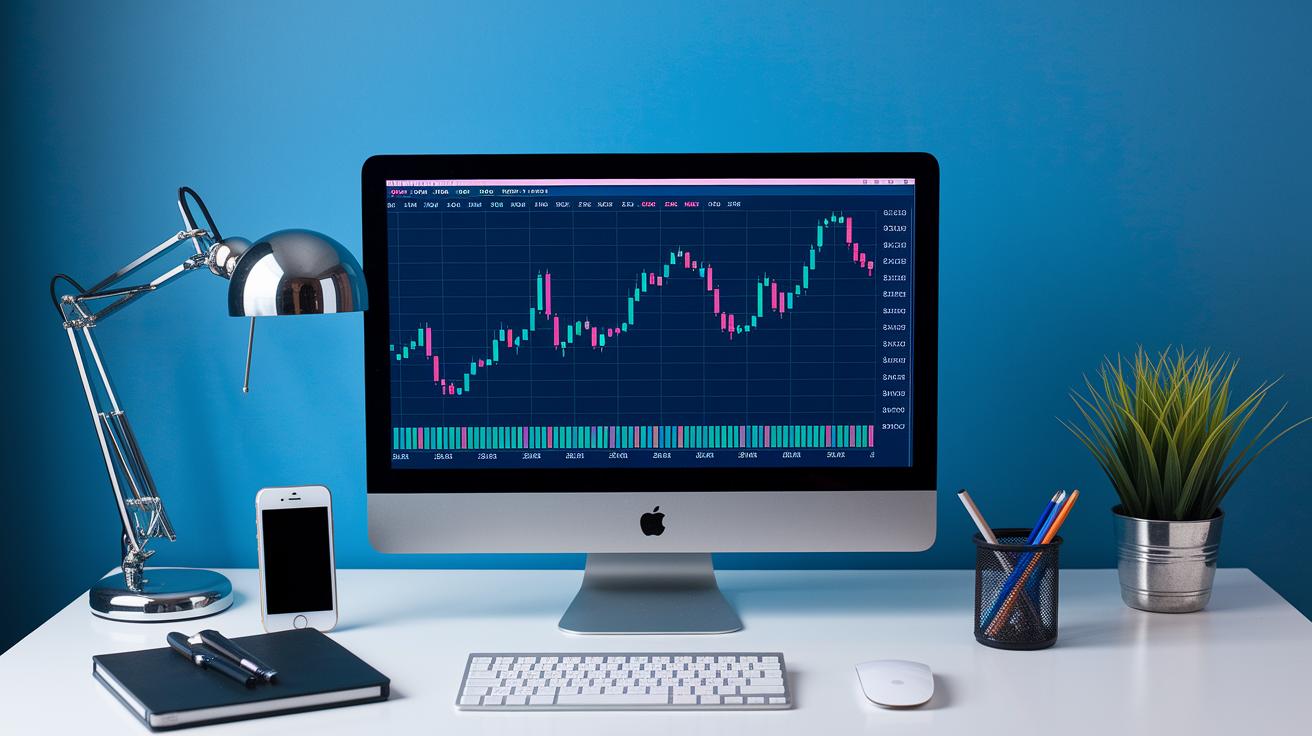
eurusd technical analysis Boosts Confident Trading

The EUR/USD, often nicknamed the Fiber, shows us the heartbeat between the Eurozone and the U.S. markets. Its price moves have been a reliable guide for traders for years. Lately, we’ve seen it climb from around 1.1589 to nearly 1.1689. This jump came after U.S. inflation data came in lower than expected, giving the euro a boost and restoring trader confidence. It’s a clear reminder that keeping an eye on trends today is more important than ever.
Technical tools are playing a big role here. For example, the Relative Strength Index (RSI, a simple tool that tells you if an asset might be overbought or oversold) is still balanced, hinting that there’s room for more gains. At the same time, the Moving Average Convergence Divergence (MACD, which helps spot changes in market momentum) has turned positive, with its histogram rising above the signal line. This tells us that the upward push might stick around, giving traders that extra bit of reassurance when assessing the market.
Now might be a good time to think about an entry around 1.1580. This point works well with a smart risk-reward setup, aiming for a target near 1.1800 while keeping a stop-loss at 1.1500 to control risk. The next major hurdle is at 1.1700; breaking past that level could open the door to testing the high of 1.1819.
- The overall trend is bullish, supported by a strong rebound.
- RSI and MACD signals are showing steady, positive momentum.
- An entry at 1.1580 offers a smart balance between risk and reward.
- The resistance at 1.1700 is key and will likely shape upcoming moves.
- Historical price behavior adds to the optimistic outlook for the euro-dollar pair.
Identifying Key Support and Resistance Levels in EURUSD Technical Analysis
Static support and resistance levels give you a steady backdrop of key price limits. Meanwhile, dynamic pivot formulas move with the market’s current flow, helping catch quick changes in mood. Traders often use both methods, using static levels to mark classic price barriers and dynamic pivots to spot short-term shifts.
Take the daily pivot set, for example: S1 is 1.1572, P is 1.1650, and R1 is 1.1697. This set outlines the main zones for the day’s trading. An alternate intraday pivot, where S1 is 1.1622, P is 1.1683, and R1 is 1.1782, offers clues about immediate market trends, which might hint at the best moments to enter or exit a position.
| Level Type | Value | Trading Implication |
|---|---|---|
| Daily Pivot Set | S1: 1.1572, P: 1.1650, R1: 1.1697 | Sets a basic guide for planning daily entries and exits |
| Intraday Pivot | S1: 1.1622, P: 1.1683, R1: 1.1782 | Catches quick shifts for shorter-term trades |
| Weekly Support | 1.1582 | Important for a retest around 1.1819; breaking it might push prices lower |
Every pivot level offers clues about the market’s direction. The steady daily set shows long-term support, while the intraday pivot highlights small shifts that can help you time your entries or exits as prices move through these key zones.
Utilizing Fibonacci Retracement and Candlestick Patterns for EURUSD Entries

Let’s dive in. Start by spotting the price move from 1.1390 up to 1.1729. This rise sets our key levels. You’ll notice the 23.6% level near 1.1645, the 50% level around 1.1559, and the 61.8% level close to 1.1486. These points act like markers where the price might pause or bounce back, creating a simple map for where the market could switch directions.
Next, add in some classic candlestick patterns. If you see a bullish engulfing pattern near support, it’s a little nod that buyers might be stepping in. A hammer formation at a pivot can hint at a bounce, and a morning star setup at one of these levels could signal a turnaround. These visual cues make it easier to catch short-term shifts that work well with the Fibonacci guides.
A smart move is to mix these Fibonacci zones with trendlines. When a Fibonacci level crosses a trendline, that overlap can be a strong signal that it’s a good time to enter. For example, if the 50% retracement around 1.1559 meets a downward trendline, it creates a neat overlap that builds confidence in making a trade. This blending of techniques offers a clear and reliable way to time entries in the market.
Analyzing Moving Averages, MACD, and RSI Indicators on EURUSD Charts

Exponential moving averages, or EMAs, give us a quick snapshot of how prices have moved recently. On a 4-hour chart, when the EMA50 crosses above the EMA200, it signals that the recent prices are climbing faster than the older ones. This simple move helps confirm that the market is on an upward path, and many traders rely on this method because it cuts through the clutter. For instance, if you see the EMA50 slide above the EMA200, it often means the uptrend could stick around, which might boost a trader’s confidence.
The Relative Strength Index, commonly called RSI, shows how strongly a currency is moving by comparing its gains and losses. Right now, a daily RSI around 55 tells us there's still a bit of room for price gains before things might get too heated. In other words, prices are up, but they haven’t reached a level that might force a quick reversal. Watching these RSI levels can be really helpful if you’re wondering whether to hold onto your position or wait for a clearer signal.
The MACD is another handy tool that measures momentum. Recently, its histogram jumped above the signal line, hinting that momentum is on the rise. But keep an eye on the 1-hour oscillator too, signals around the 1.1700 level suggest there might be a slight pullback soon. Trusted guides like "Does Technical Analysis Work" back up these insights, giving traders extra confidence when timing intraday moves.
Chart Patterns, Pivot Framework and Risk Management Techniques for EURUSD Traders

Chart patterns like channels and flags give us easy-to-see clues when the market is about to burst out of a trading range. When prices get into the 1.1770 to 1.1800 zone, it's a good idea to keep an eye out for signs that selling might be coming if the market starts losing steam. These patterns act like little signals, telling you when things might be about to change so you can plan your entries and exits accordingly.
In swing trading, pivot-based triggers are like the safety nets that catch you when the market shifts. Key support levels at 1.1630, 1.1550, and 1.1480 not only help protect against sudden price drops but also hint that a reversal might be on the way. By watching these levels, you can better understand short-term price movements and decide when to get more cautious or prepare for a breakout. Combining these steady points with dynamic pivot formulas gives you a balanced way to track market momentum in real time.
A thoughtful risk management plan is essential for a winning strategy. Imagine placing a buy order at 1.1580, aiming for a target of 1.1800, and setting a stop-loss at 1.1500, that setup offers a strong risk-reward ratio. Keeping stop losses near well-known support levels helps limit potential losses, while clear target zones ensure your trades stay on course. And with recent mid-year forecasts from over 30 banks showing more positive euro sentiment, this careful, calculated approach feels even more validated.
Final Words
In the action, we broke down the EUR/USD pair’s recent pulse, touching on trend signals, key indicator readings, pivot and resistance zones, and candlestick insights. We saw how Fibonacci retracement and moving averages work together to guide strategic entries and risk management techniques.
This focused eurusd technical analysis blends market momentum with tactical setups that help you seize opportunities. Stay confident as you apply these clear, data-driven steps to your trading practices and enjoy smart, informed decisions ahead.