Ever wonder if your stock screener filters are just right? It might only take a few small changes to uncover stocks hiding in plain sight. This guide walks you through easy adjustments that turn your basic tool into a smart helper for spotting winners.
Imagine tuning your car engine so that every gear shift feels smooth and powerful. Ready to try clear steps that save you time and boost your investing approach? Let's dive in and see how each filter can work harder for you.
Step-by-Step Guide to Optimizing Stock Screener Filters for Precise Picks
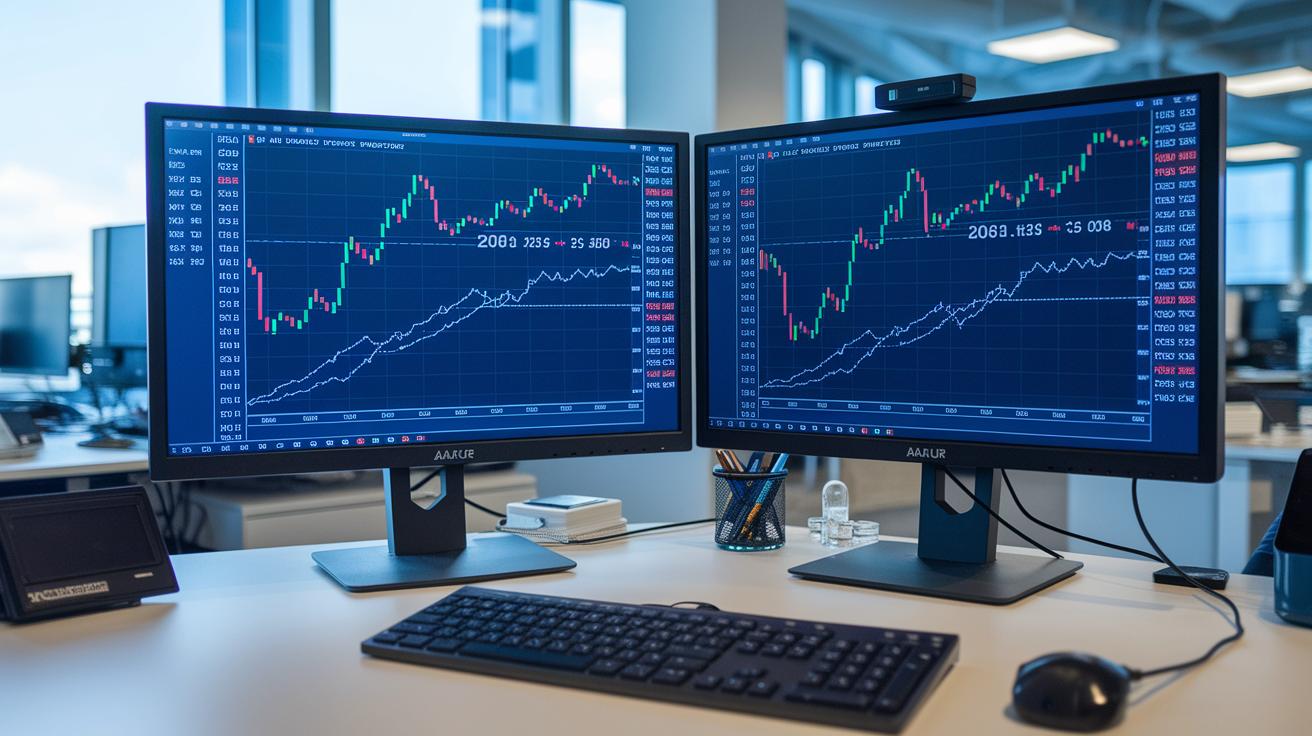
When you fire up the YCharts stock screener tool, you’re greeted by a neat and simple display that makes sorting through thousands of stocks feel almost effortless. It saves you a lot of time compared to scanning each stock one by one. Plus, with ready-made templates at your fingertips, you can set up your search in minutes. This tool, which we call a stock screener, helps you target particular groups in the market.
Next, decide on the main things you want to check. Look at valuation ratios, like P/E (price-to-earnings, which tells you how much investors are paying for a company’s profits) and P/S (price-to-sales, which compares the stock price to the company’s revenue). Also, consider performance filters like momentum (how fast a stock's price is rising or falling) and max drawdown (the biggest drop a stock has seen). Adding filters for sectors helps spread out your investments across different industries. Then there are the basics: filters for earnings, revenue, and debt ratios. These signs of good financial health are key. And don’t forget technical filters, such as moving averages (an indicator that smooths out price data to show trends) and RSI (Relative Strength Index, which measures how quickly a stock’s trading price changes). For instance, a simple moving average might show you the moment a stock starts moving upward.
Once you choose your filters, it’s time to set the numbers. Adjust the numbers right in the tool to shrink your list of stocks. Changing things like the P/E limit or performance cutoffs on the fly can really help you zero in on the best picks. Sometimes even the tiniest tweak can either highlight a hidden gem or filter it out, giving you the room to play around until you get the list just right.
Finally, compare the stocks side-by-side using tables. These tables let you look at more than 4,000 details, like beta (how much a stock’s price swings compared to the market) and ESG scores (which show how environmentally and socially responsible a company is). Review these side-by-side comparisons and adjust your filters as needed. This hands-on tweaking makes the whole screening process feel personal, helping you pick stocks that match your investment goals perfectly.
Key Metrics and Configuration for Stock Screener Filters

When you set up your stock screener, start by choosing clear metrics that suit how you invest. Stock screeners give you plenty of choices. You can use filters like P/E, P/B, and ROE to check on a company’s financial strength, think of it as getting a quick snapshot of how well it's doing. And if you want to follow price trends, don't skip technical filters like the 50-day or 200-day moving averages and RSI thresholds (70/30). For more ideas on technical analysis, have a look at https://nftcellar.net?p=1523.
Next, consider performance filters such as price momentum, max drawdown, and free cash flow yield. They help you see how stocks have moved over time. Dividend screens that look for a yield over 7% along with a payout ratio of 70% or less can point you toward income opportunities. Plus, using sector filters can help spread your investments across different industries, which is key to reducing risk.
| Metric Category | Examples | Purpose |
|---|---|---|
| Fundamental | P/E, P/B, ROE | Check financial health and growth potential |
| Technical | 50-day/200-day MAs, RSI, MACD | Spot trends and market signals |
| Performance | Price momentum, max drawdown, FCF yield | Track stock movement and stability |
| Dividend | Yield >7%, payout ratio ≤70% | Uncover income-generating opportunities |
Real-World Filter Tuning Examples in Stock Screeners
Sometimes it only takes a few small changes to make your stock screening process work much better. Imagine playing with moving averages (like the MA crossover where one average line crosses another) or adjusting Bollinger Bands (which help show when a stock's price may soon change) and even tweaking RSI settings (a tool that measures price strength). For example, in April 2023, Apple (AAPL) saw its 50-day moving average cross above the 200-day one, a move known as a Golden Cross, which helped spark a 30% rally. Pretty neat, huh?
Then there’s GameStop (GME) in January 2021. After a Bollinger Band squeeze, which means the price bands shrank and hinted that a breakout might be coming soon, it broke out clearly. And another trick is using a 2-day RSI Reversal Screener. This tool has been good at spotting short-term reversals, giving useful hints on when to get in or out of a trade.
Now let’s talk about value-based screens. The Graham Number Screener can be a powerful pick for finding deep-value opportunities. For example, back in March 2020, Bank of America (BAC) traded below its Graham Number, an indicator that many investors see as a chance to buy at a bargain. Testing these tweaks over a simulated five-year period lets you check if your settings hold up under real market conditions. By comparing past results with what your filters are doing now, you can adjust your approach and get a better feel for the market’s pulse.
Combining Fundamental and Technical Filters in Your Screener
Start by setting up rules that mix basic financial numbers with simple technical signals to find quality stocks. You might, for example, filter stocks that have a price-to-earnings ratio below 15 and a relative strength index (RSI, which tells you if a stock is oversold or overbought) under 40. This approach creates a value-momentum screen that highlights companies priced attractively and showing early signs of a rise. Another idea is to pick stocks with a Debt/Equity ratio below 0.5 along with a bullish 200-day moving average crossover, suggesting both financial strength and a positive trend. In truth, blending these two data sets lets you keep an eye on key financial figures while staying aware of market trends.
Then, use presets, watchlists, and branded report features to keep your analysis fresh. Creating your own watchlists lets you see how your combined rules work over different time frames. And by saving these custom settings as presets, you can generate branded proposals that keep your strategy in tune with daily market changes.
Ongoing Optimization and Maintenance of Stock Screener Filters
Market conditions change, so it’s smart to check your stock screener filters every three months. This regular review keeps your setup sharp and helps you catch changes early. Testing against both past data and current results means you can tweak your threshold settings and run backtests to see if your filters match what’s happening in the market.
And don’t forget about automated alerts. These alerts let you know when a stock moves outside your set limits, so you can update old templates and compare new settings with past returns. By continuously checking and adjusting your filters, you stay on top of market shifts and keep your screening process steady and efficient.
Final Words
In the action, we explored the stock screener interface, chose core criteria like valuations and performance, and set thresholds to reap detailed results. We saw real-world examples, combined fundamental and technical filters, and discussed ongoing reviews to keep screening sharp. This approach helps you learn how to optimize stock screener filters while staying updated on market trends and managing risk effectively. Each step builds confidence and makes financial analysis more accessible, leaving you ready to seize fresh opportunities ahead.
FAQ
How do I optimize stock screener filters using community insights and free tools?
Optimizing stock screener filters with community tips or free resources means adjusting settings like valuation ratios and performance metrics based on shared insights. It’s all about testing and refining your thresholds.
What are some popular stock screener platforms such as TradingView, YouTube stock screener, Finviz, and Investing.com?
Popular platforms like TradingView, Finviz, and Investing.com offer interactive charts, preset filters, and live market data. YouTube also provides visual guides and tutorials to help you understand these tools.
How do I use Investing.com’s stock screener?
Using Investing.com’s stock screener involves selecting core criteria like valuation and performance, setting thresholds, and reviewing filtered results for precise equity picks that match your strategy.
How do I filter chicken stock using a stock screener?
To filter chicken stock, adjust your screener’s settings to target companies in the poultry or food production sector. Use keywords and industry filters to narrow down the list effectively.
How do I use a stock screener effectively?
Using a stock screener effectively means setting clear criteria for valuation, performance, and sector classification, then analyzing comparison tables and adjusting filters based on live market data for precise selections.
What does the 3-5-7 rule in stocks signify?
The 3-5-7 rule in stocks is a heuristic some investors use to prioritize metrics. It represents a structured notion of reviewing three key financials, five performance indicators, and seven risk factors, though definitions can vary.
What does the 70/30 rule in stocks signify?
The 70/30 rule in stocks suggests a strategy that balances stable, long-term investments with growth opportunities. Investors may use it to allocate a larger portion to conservative picks while reserving a smaller portion for higher growth.
What does the 90% rule in stocks signify?
The 90% rule in stocks might refer to a threshold for identifying undervalued stocks, such as those trading at 90% of their historical pricing levels. Interpret this guideline within the context of your investment strategy.