Ever feel bombarded by market ups and downs? Imagine a tool that lets you peek right into live market moves, showing every little shift as it happens. The clear visuals and simple tools make even heavy data feel like a friendly tip from someone who knows their stuff. It’s almost like chatting with a smart pal who helps you spot trends so you can move fast. This kind of tech really changes how you trade, cutting out the guesswork and giving you the edge you need.
Achieving Dynamic Market Analysis with Interactive Charting Software
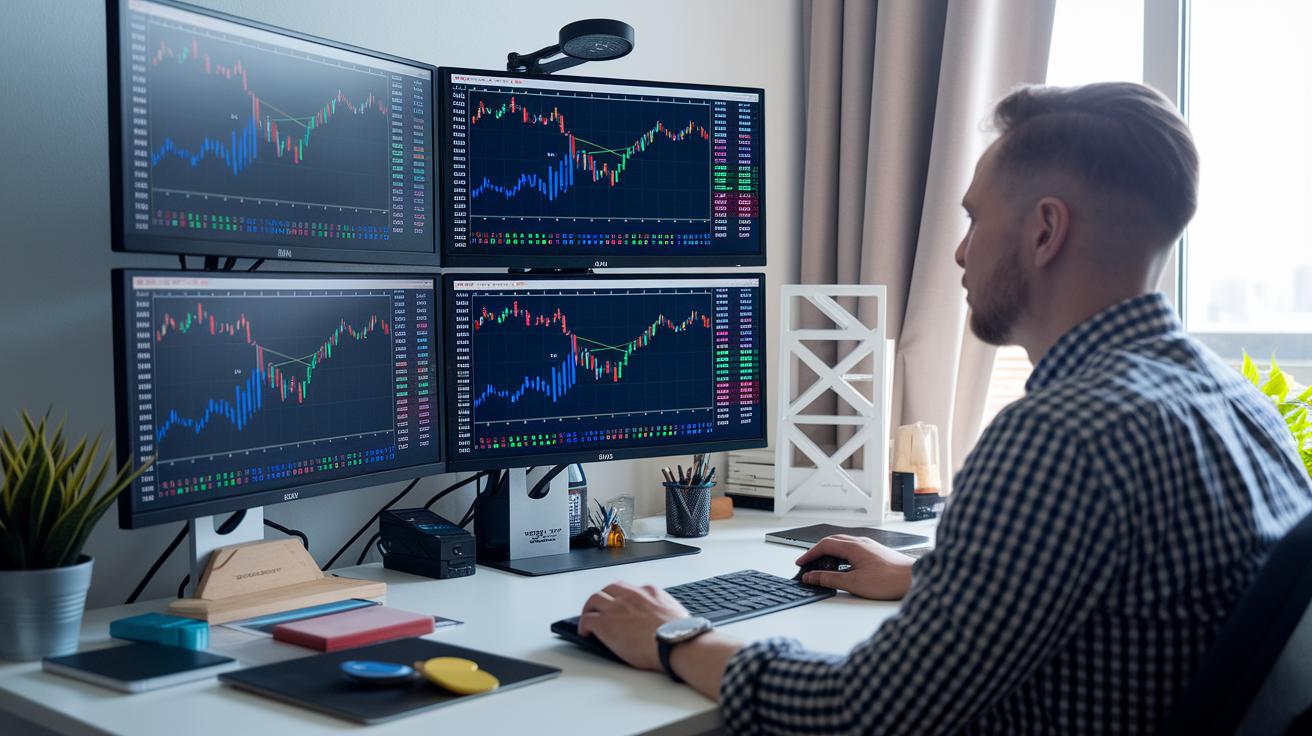
Imagine watching the market like it’s a live show, where every twist and turn appears right before your eyes. Interactive charting software makes that possible by offering real-time visuals and live price updates, so you’re never left wondering what’s happening. The charts refresh quickly, even as new data streams in, letting you track every little change like watching ripples on a pond.
And there’s even more to it. Many platforms come with huge libraries of custom tools and allow you to view data over different time frames. For example, TradingView supports millions of traders and features community-built chart indicators that add extra depth. Tools like TrendSpider even use smart AI to detect trendlines automatically, so you can easily compare different periods with just one glance. It’s like having a trusty friend point out the patterns you might miss on your own.
Mixing fast data updates with interactive plotting gives you a clear edge in tracking market movements. StockCharts offers various chart styles, from candlestick to line charts, so you can pick what works best for you. Meanwhile, Koyfin adds gridlines along with tools to view growth rates and drawdowns. These visual tools break down complex market data into clear, understandable insights, empowering you to respond to changes swiftly and confidently.
Key Features of Interactive Charting Software for Traders
Interactive charting software gives traders a handy toolbox to refine their market moves. It’s like having a smart friend that uses automation to spot trends and patterns, while backtesting helps you see what works best. Think of it this way: platforms such as TrendSpider or TradingView give you access to loads of custom indicators and various chart types, transforming messy data into clear signals. Whether you’re tracking price shifts or checking order flows, these tools make trading feel like a clear, well-planned strategy rather than a guessing game.
- Automated pattern recognition and AI-driven alerts
- Multi-chart and dual-chart comparison views
- Easy-to-use annotation and trendline adjustments
- Mapping of support-resistance and pivot points
- Real-time display of volume and order flows (Volume Analysis in Technical Analysis)
- Custom technical overlays and indicators
- Graphs that adjust to different time intervals
- A shared charting hub for collaborative analysis
These features are built with traders in mind. With user-friendly automation combined with detailed technical tools, you get a powerful mix that helps you react quickly when markets shift. Tools like volume visualization and support-resistance mapping add confidence by showing you a clear snapshot of the market. In short, by blending past data with live market updates, interactive charting software turns complex numbers into a simple, intuitive trading map.
Comparing Leading Interactive Trader Platforms
Interactive charting software is key for traders, and picking the right platform can really boost your trading routine. It’s like having a trusted map when navigating busy streets.
For example, TradingView is famous for its huge list of indicators and a friendly community of more than 30 million users. It’s like joining a big group where tips and ideas are always shared.
Then there’s TradeStation, which not only gives you powerful charting tools but also lets you trade directly from the charts. This makes it easy to move from analysis to action without missing a beat.
TrendSpider is another cool option, it uses AI to spot trends automatically, taking the guesswork out of drawing trendlines for tech pros. Stock Rover, on the other hand, is perfect if you need solid portfolio tracking and in-depth performance details. And if you’re often on the move, Webull’s mobile-friendly design has you covered.
Interactive Brokers is great for those who lean toward algorithm-based strategies, offering handy API connectivity. Meanwhile, thinkorswim remains a favorite among tech analysts with its detailed analytics that work smoothly across devices.
By comparing key chart metrics, you can figure out which platform fits your trading style best. Whether you appreciate automatic technical insights or need a flexible mobile experience, the table below gives you a quick look at each platform’s strengths, target users, and pricing models. This easy-to-read comparison helps set clear expectations and guides you toward a tool that grows with your evolving trading strategies.
| Platform | Strength | Best For | Pricing Model |
|---|---|---|---|
| TradingView | Indicator Library | Active Traders | Free, $14.95–$59.95/mo |
| TradeStation | Broker Integration | Trade Execution | Freemium |
| TrendSpider | Automated Analysis | Technical Pros | Subscription |
| Stock Rover | Portfolio Tracking | Investors | Free & Premium |
| Webull | Mobile Charting | On-the-Go Traders | Free |
| Interactive Brokers | API Connectivity | Algo Traders | Commissions |
| thinkorswim | Advanced Analytics | Tech Analysts | Free |
Customization and Integration in Trader-Centric Chart Interfaces

Today’s charting tools let you set up your trading space just the way you like it. You start with a blank canvas and easily place your charts and technical signals using a simple drag-and-drop feature, much like arranging your favorite photos on a digital collage. And thanks to cloud-saved layouts, you can switch between devices without losing your setup.
The platform also brings live data feeds directly to you, letting you adjust charts, indicators, and filters on the fly. Think of it like updating your playlist to match your mood; you can tweak your tools in real time and stay on top of market changes effortlessly.
Plus, a shared charting hub helps teams work together. It allows you to exchange custom layouts and insights, so everyone stays aligned and ready to respond to market shifts.
Pricing Structures and Subscription Plans for Interactive Charting Software
Charting software for traders is available in both free and paid versions. Free plans come with basic charting tools so you can try the features without spending any money. For example, StockCharts offers a free option that lets you export and share charts, while thinkorswim and Webull provide strong technical charting at no cost. This makes them a great choice if you're just starting out but still want a full-featured trading setup.
Paid subscriptions add extra tools and live data updates. Take TradingView, for instance. They offer everything from a free plan to a Pro+ option at $59.95 per month, which includes more indicators and faster live data. TrendSpider uses monthly or yearly subscriptions that not only update features on time but also include AI-powered analysis. Finviz Elite upgrades let you enjoy full-screen charts and backtesting, and StockCharts’ Silver and Gold plans bring in real-time data to give you a smoother user experience.
When deciding on a plan, think about how often you trade and what features are important to you. If you trade a lot and need detailed data and automatic alerts, a paid plan might be the way to go. But if you're just exploring the platform, the free version could be the perfect starting point.
Evaluating User Feedback and Performance Benchmarks for Interactive Trading Charts

Traders share mixed feelings about interactive charting software. Many TradingView users love its easy-to-use design and helpful community scripts that make technical analysis simple. TrendSpider’s smart, AI-based tools wow seasoned traders, though beginners might find it a bit tricky at first. StockCharts wins points for being reliable, even if its look feels a little old-fashioned. TIKR gets a thumbs-up for its low-cost coverage of basic fundamentals, but it doesn’t offer advanced overlays. Yahoo Finance stands out for providing free real-time quotes, while Finchat is praised for its AI-powered fundamentals despite not having live updates on all platforms.
Speed and clear updates are key for traders. Fast data rendering and quick indicator refresh times help traders catch market shifts as they happen. Today, many platforms also offer real-time insight generators and analytic dashboards (see Technical Analysis) that show market trends in a clear way. These quick updates let traders spot patterns fast and adjust their strategies on the go. In truth, meeting tough performance benchmarks helps traders turn even wild market swings into smart, quick moves every time.
Final Words
in the action, the blog walked through real-time market visuals, smart feature comparisons, and practical risk strategies. It showed how powerful tools can help you keep up with fast-changing price updates while managing your investments wisely. Each section brought clear and friendly insights that connect with day-to-day trading. With a clear look at setups and subscription plans, you’re ready to tackle markets head-on using interactive charting software for traders. Embrace these insights and move forward with a positive outlook.
FAQ
What are some free interactive charting software options for traders?
The query for free interactive charting software options points to platforms like TradingView’s free plan, Webull’s charting features, and thinkorswim’s tools that provide real-time data and buy-sell signals without the cost.
What is considered the best trading charting software?
The question about the best trading charting software indicates that the ideal choice depends on your needs, with popular options including TradingView for its vast indicator library, MetaTrader for forex tools, and TrendSpider for automated analysis.
What charts do traders use?
The inquiry about the types of charts traders use suggests that candlestick, line, and bar charts are common, each offering a clear view of price movements and volume to aid in market analysis.
Is GoCharting better than TradingView?
The comparison of GoCharting versus TradingView shows that while both platforms offer valuable features, many traders lean towards TradingView for its extensive community, customization, and a broader range of technical indicators.
What chart do most day traders use?
The question regarding the chart most day traders use highlights that candlestick charts are favored, as they clearly display price action and patterns, supporting quick decision-making during rapid market shifts.
How do MetaTrader 4 and MetaTrader 5 compare to platforms like TradingView and MetaStock?
The comparison between MetaTrader platforms and TradingView or MetaStock illustrates that MetaTrader offers strong forex tools and automated strategies, while TradingView and MetaStock provide diverse charting options and real-time analytics for a broader range of markets.