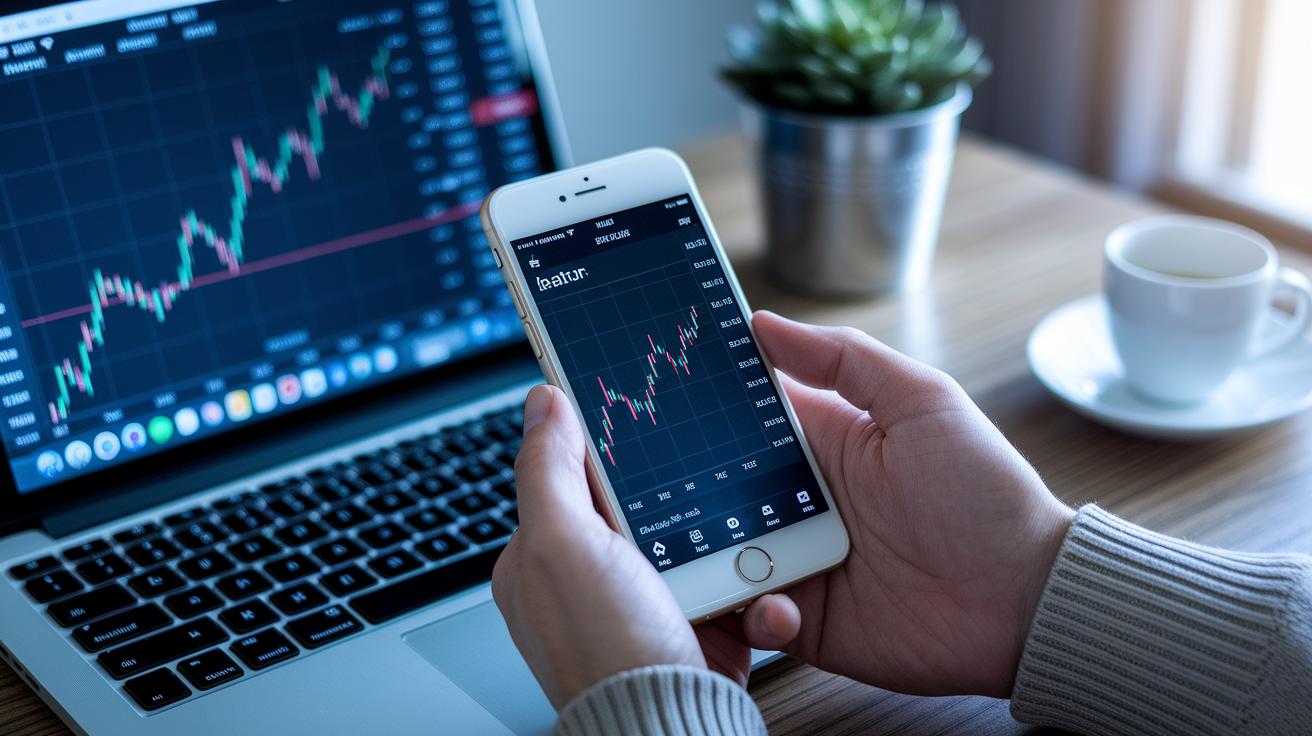
Ever think getting a clear view of your market insights could be as simple as glancing at one screen? Now imagine an investment tracker that shows all your stocks, ETFs, and crypto in one neat display. Picture this: your investments updating in real time as the market moves. No more jumping from website to website or missing important changes. This handy tool makes a complex job simple, giving you a clear snapshot of where you stand. Let's dive in and see how this tracker helps you keep your investments on target every step of the way.
Real-Time Monitoring and Analysis With an Investment Portfolio Tracker
Imagine all your financial accounts coming together on one easy-to-read screen. With this tracker, you can quickly see your stocks, ETFs, and crypto holdings without switching between sites. It’s like stepping into a well-lit room where everything is in plain view. This neat setup saves you time and takes away the hassle of managing multiple platforms.
The tracker talks directly with your brokerage accounts, so every market move makes your numbers change in real time. Think of it as watching the steady beat of a market heartbeat, your portfolio updates right after you make a trade, keeping you one step ahead.
- One dashboard that shows all your holdings
- Live market data coming from your brokerages
- Easy monitoring of stocks, ETFs, and cryptocurrencies from around the world
- Fast comparisons of performance over time intervals you choose
- Alerts that let you know when prices change significantly
- Tools to help you understand your asset mix and how well it’s spread out
These features work together to give you a clear, live snapshot of the market. With updates happening in real time, you can quickly decide if your investments are on track. A quick look tells you whether your portfolio is balanced and meeting your goals, even as market conditions change.
Core Features of Top Portfolio Monitoring Tools

Modern portfolio trackers bring together tools that make it simple to see how well your money is working. They mix a clear dashboard with smart visuals, so you can keep an eye on gains, spot trends, and understand risks without feeling overwhelmed.
Performance Dashboards
Performance dashboards are built to be simple and flexible. They let you choose a date range to check summary numbers like total returns, profit or loss, and performance over time. For example, you can set it to show a weekly view that highlights your portfolio’s growth and warns you if things suddenly dip. It gives you both a big picture view and a close look at how you compare to the market.
Interactive Investment Charts
Interactive investment charts bring your data to life with line graphs, bar charts, and pie charts. They show trends and changes with a quick glance so you understand how individual trades impact your portfolio. Imagine a colorful pie chart that breaks down your assets, or a bar graph that makes monthly gains and losses crystal clear. Even if you’re just starting out, these charts make complex numbers feel familiar.
Asset Allocation Checkers
Asset allocation checkers sort your portfolio by industry, region, asset type, and more. This tool helps you see if your investments are spread out evenly or too focused in one area. For instance, you might see how much you’ve invested in tech stocks compared to international bonds. Such insights help you spot risks and keep your investments balanced.
Dividend Yield Checkers
Dividend yield checkers focus on the income side of your portfolio. They track your dividend history and even make simple predictions about future payouts in markets like the US, UK, Europe, Canada, and Asia. This way, you can see if your earnings from dividends are on track and plan ahead for reinvestment.
Integration and Data Synchronization for an Investment Portfolio Tracker
Managing your trades shouldn’t feel like a full-time job. With our tracker, you can easily gather all your trading information in one place. You can import your trade history by connecting directly with your broker’s API or by simply uploading a CSV or XLSX file. This means your past transaction records are updated automatically, letting your financial picture stay fresh and clear.
Real-time market data feeds add another layer of ease. They work like a steady pulse, giving you regular price updates and vital event calendars, from IPOs to earnings reports and even market heatmaps. With these live updates in hand, you can spot key events that might shift your portfolio, and adjust your investment strategy on the fly.
Some platforms even go further by offering two-way integration. This means you can not only keep an eye on your investments but also place trades right from the tracker. It’s a smart blend of monitoring and active trading that lets you respond quickly as market conditions change.
Mobile Apps and Custom Dashboards in Portfolio Trackers
Today, many portfolio trackers come with friendly iOS and Android apps that let you check your investments anytime you like. These mobile apps are built to give you a quick, clear look at your holdings. Imagine grabbing your phone with your morning coffee in hand and instantly seeing how your stocks are moving. It feels secure and puts you in control.
Then there are cloud-based trackers that make life even easier. When you update something on your computer, it shows up on your phone right away. Picture checking your portfolio after a market update and seeing the same numbers on your desktop and mobile screen. This real-time syncing helps you manage your investments without missing a beat.
Many platforms also allow you to create custom dashboards using tools like Excel investment log templates or Google Sheets. This means you can stick with a format you know while enjoying digital tracking. For instance, you might load your past trade history from an Excel file and then see interactive charts bring those numbers to life. It’s a great mix of old and new that can really work for you.
With custom tracker templates, you can tailor every detail of your portfolio view. Set up mobile alerts for price thresholds, trade confirmations, and dividend payments so you never miss an important market move. Imagine configuring a dashboard that highlights your favorite sectors or stocks. This kind of personalization makes managing your investments feel just right for your style.
Pricing Models: Free vs Paid Investment Portfolio Tracking Software
Investment portfolio tracking software comes in two tiers designed to fit different needs. Free options like Empower, M1 Finance, and Fidelity let you see basic dashboards, link your accounts, and check performance charts without spending a cent. These tools give you a solid way to keep an eye on your assets without any extra cost.
On the other hand, paid tools such as Kubera and Portseido come with a subscription that opens up advanced features. This means you can track more asset classes, enjoy enhanced analytics, and receive priority customer support. It’s a bit like choosing between a simple meal and a full-course dinner when you need more details about your investments.
| Tracker Tier | Price Model | Key Features |
|---|---|---|
| Free Trackers | $0 | Basic dashboards, real-time data, account links |
| Standard Subscription | $5–15/mo | Advanced analytics, historical logs, custom alerts |
| Premium Subscription | $20–30/mo or $360/yr | Private assets, API access, priority support |
Different investors pick the option that fits their portfolio size and the insights they want. Beginners or those with simple investment goals often start with free tools because they’re simple yet effective. More active traders or high-net-worth individuals might prefer standard or premium subscriptions to dig deeper into data, getting the smarter market insights they need to make informed financial choices.
Selecting the Right Investment Portfolio Tracker for Your Needs

When you’re on the hunt for a portfolio tracker, make sure it shows your different asset classes clearly. Look for tools that break down your investments into stocks, cryptocurrencies (digital currencies you can trade online), bonds, and more. A great tracker will use simple charts or tables to show how your assets perform over different time periods. For instance, it might give you side-by-side views of past returns so you get a clear picture of potential gains and risks.
Different investors need different features. If you’re just starting out, a free tracker with an easy-to-navigate interface might be perfect. But if you’re more focused on earning dividend income, you’ll want a tool that keeps a close eye on payout histories. And if you hold investments from around the world or dabble in crypto, you’ll benefit from multi-currency support and international insights. Even high-net-worth investors often appreciate tools that integrate data on private market investments so all their assets are in one spot.
User feedback and good customer support can make all the difference. It helps a lot when you find reviews praising intuitive navigation and solid mobile performance. A friendly and responsive help desk can turn a good experience into a great one. When you’re reading reviews, check for mentions of easy setup, regular updates, and clear dashboards. These signs show that the tracker will not only cover your basic needs but will also grow with your changing investment goals.
Final Words
In the action, we explored how a modern investment portfolio tracker brings live market updates, unified dashboards, and seamless data integration together. The post highlighted both core and mobile features with clear examples, making risk management and timely insights within reach.
By breaking down pricing models and comparing tools for diverse investor needs, you now have a handy guide to smart investing. Every step takes you closer to building a more secure, informed investment strategy.
FAQ
What is the best investment portfolio tracker?
The best investment portfolio tracker offers a consolidated view of your investments using live updates and performance metrics, allowing you to monitor stocks, ETFs, and other assets all in one place.
Is there an app that tracks all my investments?
The investment tracking app collects all your portfolio details into a single dashboard, syncing real-time market data and sending price alerts so you can manage your investments easily on the go.
Are there free portfolio trackers available?
The free portfolio tracker provides essential features like basic dashboards, real-time data, and account linking at no cost, making it a great starting point for monitoring your investments.
What do the 7% rule and the 70/30 rule in investing mean?
The 7% rule often refers to a target return expectation, while the 70/30 rule suggests splitting investments into 70% lower-risk assets and 30% higher-risk assets to maintain balance in your portfolio.
How do trackers like Yahoo Finance and Empower help in managing portfolios?
The Yahoo Finance and Empower trackers merge market data with interactive tools, allowing you to visualize asset performance, assess diversification, and receive live updates for a clearer investment overview.
Can I create a stock portfolio online?
The online stock portfolio tool lets you build and manage your investments through a web-based platform, giving you the ability to track performance, review asset allocation, and make informed decisions easily.
What core features should I look for in an investment portfolio tracker?
The key features include customizable performance dashboards, interactive charts, asset allocation checkers, dividend yield trackers, real-time updates, and seamless data synchronization for comprehensive portfolio monitoring.