Ever thought about making your portfolio tracker work for you rather than the other way around? Picture this: turning your Excel sheet into a clear picture of your financial progress, a dashboard that takes care of the hard work. In this post, I'll walk you through simple steps to set up a tracker that updates automatically while keeping your data neatly organized. Ready to track smarter and boost your confidence in your investments? Let’s dive in and get started.
Step-by-Step Portfolio Tracker Customization Tips for Your Dashboard Setup
First, fire up a new Excel workbook and set up your Portfolio Input Sheet. Make sure you have clear columns for stocks, bonds, ETFs, and cash. Fun fact: Even experienced traders used paper records before automation came along to turn messy data into crystal-clear insights. Arrange your tables neatly so you can easily connect them to your dashboard modules, whether it's for total return, money-weighted return (a measure of performance that accounts for cash flows), asset breakdowns, dividends, fees, or taxes.
Next, add formulas throughout your workbook to do the heavy lifting automatically. For instance, use a formula to sum daily transactions and refresh performance metrics without constant manual updates. You might also use Excel Web Queries or tracker APIs to bring in live market data. This way, your dashboard always shows the latest activity. Place the key performance widgets right up front and group similar metrics together. Create a summary section that highlights vital figures like total returns, daily changes, or even real-time alerts.
Then, bring a bit of extra polish to your dashboard with smart widget placement. Play around with where your data blocks go until everything looks logical and easy on the eyes. Tweak the colors and fonts for extra clarity, and consider using conditional formatting, like changing a cell’s color when a value hits a set threshold, to make key numbers pop. Think of this process as designing your own personalized finance app, giving you a clear snapshot of your portfolio at any moment.
Data Visualization Customization Tips for Portfolio Trackers
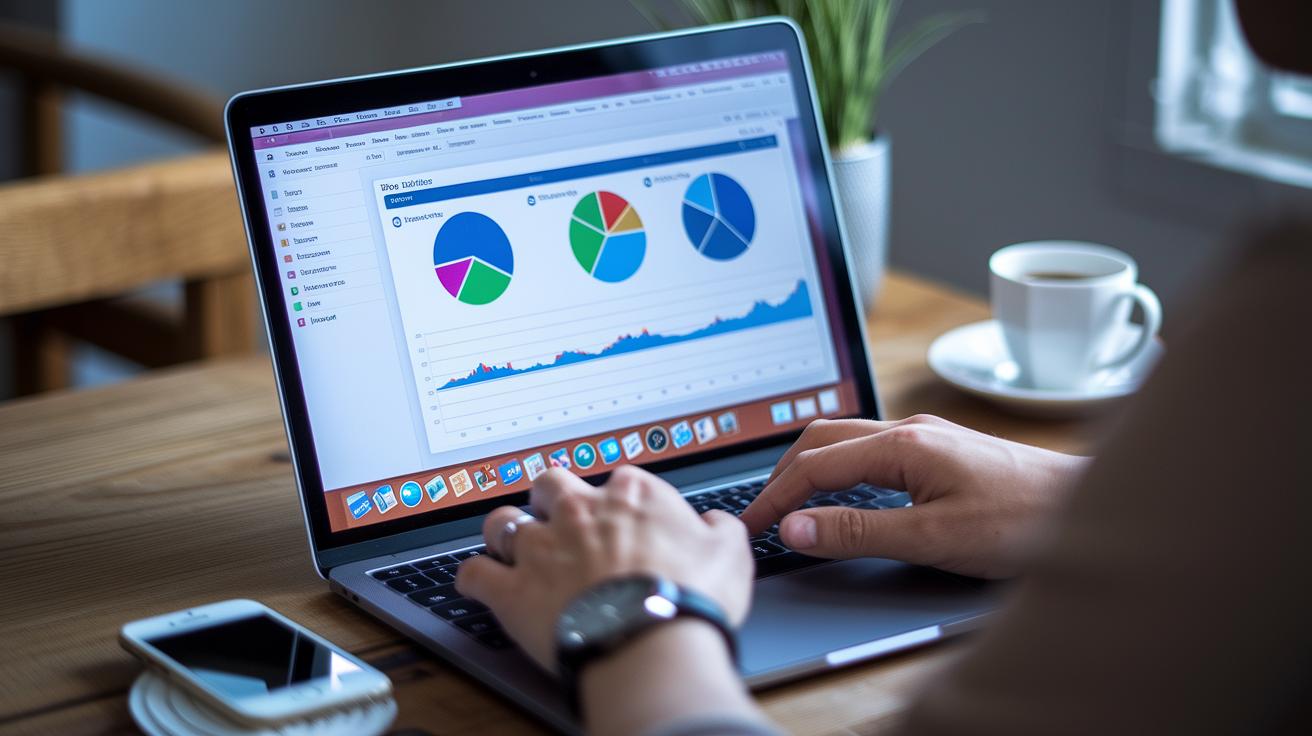
Turn your portfolio tracker into a tool that feels as friendly as chatting with a buddy. Start by rethinking how you show your numbers. Picture your charts as little storytellers that break down complex figures into simple, clear images. Begin with custom pie charts for your asset mix, using distinct colors so you can spot each asset quickly. Add interactive filters and clear formatting that changes as your numbers do, like alert colors that pop when key thresholds are hit. You can even use small icons to show how things are performing, making your tracker feel personal and alive.
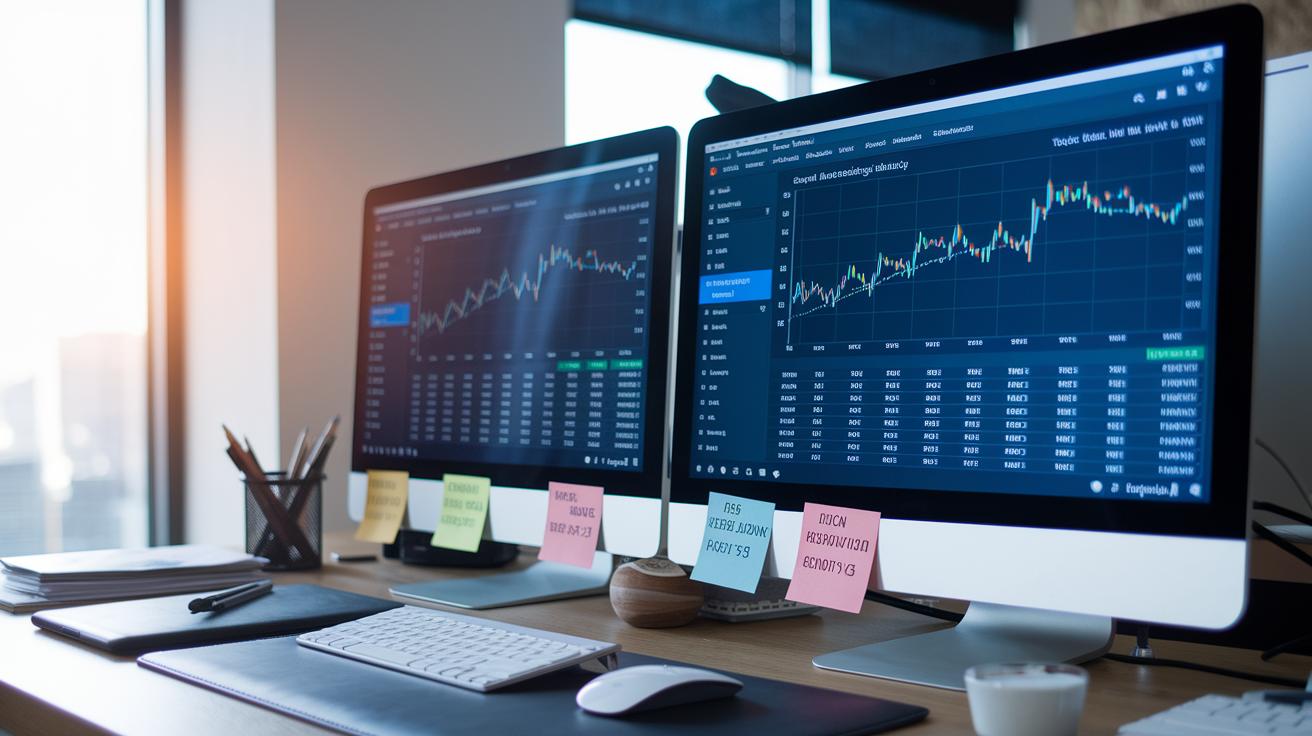
Next, give your charts even more personality by fine-tuning interactive elements like line and bar charts. Adjust the axis scales and add easy-to-read labels so your trends jump out at you. With custom color choices, every chart stays clear, even when numbers change constantly. When every part of your dashboard fits together nicely, it feels like a well-organized story. Try out these tips to create charts that not only track numbers but also reveal the story behind every financial move.
| Chart Type | Use |
|---|---|
| Pie Chart | Asset Allocation |
| Line Chart | Performance Trend |
| Bar Chart | Metric Comparison |
| Scatter Plot | Risk vs Return |
Alert Configuration Tips within Portfolio Tracker Customization Tips
When you set up alerts in your tracker, you can use Excel Web Queries or API connections to pull in the most recent data to your spreadsheet. This means you can turn on conditional formatting or VBA macros when values hit your chosen limits. Imagine watching your price change suddenly and getting an alert when it moves by plus or minus 5%, just like a friendly tap saying, "Check your trade!" These strategies also work nicely with digital apps that send real-time notifications.
Setting Price Change Alerts
- Find the key cells where live asset prices update.
- Enter formulas that calculate the percentage change from the last value.
- Apply a conditional formatting rule to highlight cells when they reach a 5% change.
- Connect these changes to trigger a VBA macro or app notification right away.
- Test the setup with sample data to ensure the alerts work in real time.
Configuring Allocation Drift Alerts
- Compare your target allocation percentages with your current ones.
- Use formulas to spot any differences that exceed 2%.
- Apply conditional formatting to flag these noticeable shifts.
- Link this arrangement to trigger alerts through Excel macros or your app for quick adjustments.
Adaptive Filter and Custom Report Generation in Portfolio Tracker Customization Tips
Imagine having a portfolio tracker that feels like a friendly conversation about your investments. With the right filters and report designs, you can quickly see what's most important, whether that's how different sectors are performing or what your dividends add up to.
Start by setting up simple table filters and slicers. These tools let you sort your assets by groups like sector, performance tier, or dividend yield. You can see clear snapshots of your total return, breakdown of allocations, dividends, fees, and even tax effects. It’s like having a quick glance at your financial health.
Next, try using basic formulas. They can rank your holdings by metrics such as year-to-date return or expense ratio. This step turns a bunch of numbers into an easy-to-read story about your money. Creating a custom report template on a separate sheet makes it even simpler. This special report keeps a neat summary that updates on its own from your dashboard.
Here are some practical tips:
- Configure filters to display only assets within a certain performance group.
- Use slicers to switch quickly between sectors for targeted views.
- Apply simple formulas that sort your holdings based on current year returns.
- Design custom fields in your report for crucial details like fees or tax impact.
- Set up PivotTables that bring all your data together neatly for export.
After setting up your filters and reports, think about exporting them as PDFs with custom headers. This way, you preserve your work exactly as you see it. It’s an easy method for reviewing your portfolio’s performance off-screen and sharing your insights with others.
Portfolio Tracker Customization Tips: Spark Smarter Tracking
Try using drag-and-drop modules in your digital tracker. They let you arrange your layout so it works well on any device. When you shrink widgets or hide some sections for your phone or tablet, your dashboard looks neat and functions smartly.
Picture setting up your cash, bonds, and stocks next to each other, like puzzle pieces that fit perfectly on any screen. Changing the color theme for each module helps each widget show its data clearly. You might even switch on dark mode or tweak opacity settings so you can check your tracker without glare during late-night reviews.
Using add-ins or API calls to pull data from different brokers helps your tracker work the same everywhere you check it. These clever tweaks turn your tracker into a personal finance app that works with you in real time.
- Drag and drop your modules to move key parts fast.
- Resize widgets dynamically to make your tracker shine on any screen.
- Collapse sections you don’t need every moment for a cleaner mobile view.
- Customize color themes for each module so asset types pop out.
- Group related modules like cash, bonds, and stocks for that perfect puzzle fit.
- Integrate feeds from multiple brokers with add-ins to keep your data consistent.
Don't forget to save your layout presets once you find a setup that feels just right. This simple step lets you reload your optimized design quickly, so you spend less time tweaking settings and more time reviewing your performance.
Final Words
In the action, we walked through step-by-step portfolio tracker customization tips, from setting up your dashboard and styling summaries to configuring real-time alerts. We touched on fine-tuning data visualizations and using adaptive filters for clear, personalized reports.
We also looked at advanced module adjustments to create a responsive, user-friendly layout. These portfolio tracker customization tips empower you to manage risk and track market updates with a design that’s uniquely yours. Stay positive and keep refining your setup for a smarter, more engaging investment experience.