Ever feel swamped trying to keep up with your investments? You’re not alone. Building a simple portfolio tracker in Google Sheets might just be the lifeline you need. This guide walks you through each step to create your own tracker for stocks and ETFs, all without the hassle of complicated, expensive tools.
With live updates and a clean layout, keeping track of your money becomes easy to understand. It’s like having a clear snapshot of where your money’s headed every day. Ready to see how a few simple tweaks can make managing your portfolio a breeze? Let’s get started with a tool that really works for you.
Portfolio Tracker Setup: A Step-by-Step Guide for Beginners
Setting up your own portfolio tracker in Google Sheets is a simple, free way to keep an eye on your investments. With your own sheet, you decide how things look, making it easy to spot trends and see where your money is going. Plus, you can tweak the formulas whenever you want, which is a great way to learn as your strategy grows.
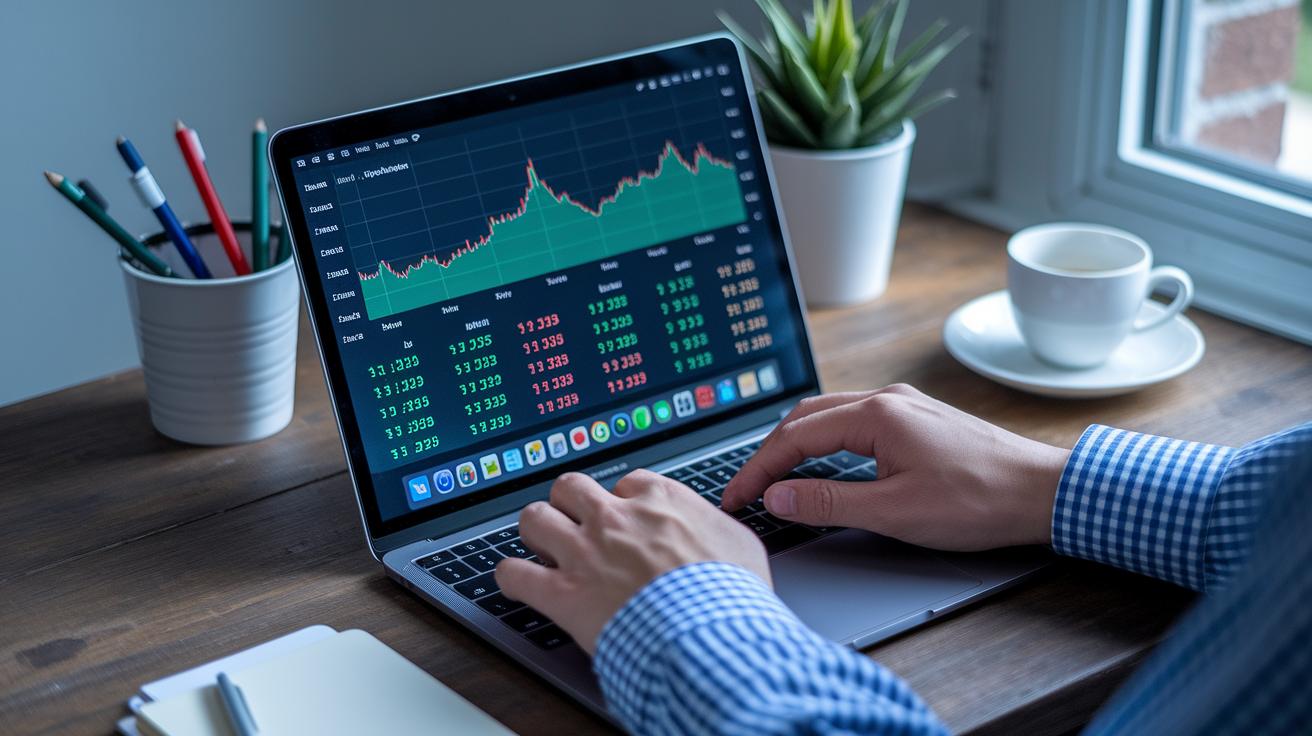
The best part? Your tracker lives in the cloud. That means you can pull it up on any device, any time. It does the basic math for you, like adding up current values and figuring out profit or loss, cutting back on mistakes you might make doing it by hand. And by using formulas like GOOGLEFINANCE, your data updates automatically. For example, type =GOOGLEFINANCE("MSFT","price") to see Microsoft’s latest stock price.
- First, open a new Google Sheet and add these column headers: Ticker Symbol, Shares Owned, Purchase Price, Current Price, Current Value, Daily Change, and Profit/Loss.
- Next, fill in your investment details under each header.
- Then, use the GOOGLEFINANCE function (for example, =GOOGLEFINANCE("MSFT","price")) in the Current Price column to bring in live prices.
- After that, create a formula that multiplies the Current Price by the number of Shares Owned. Drag the formula down the column so it applies to all your stocks.
- You can also add conditional formatting. This makes any gains show up in green and losses in red.
- Finally, check out some free Google Sheets templates online to see more examples of formulas and formatting.
Once you're done, save your tracker on Google Drive. This way, you'll always have it handy to update and stay connected with your growing portfolio.
Portfolio Trackers 101: Key Concepts and Benefits for New Investors

A portfolio tracker is like having your own personal financial dashboard that shows how your stocks, ETFs, and cryptocurrencies are doing, all in one easy-to-read place. It gives you real-time numbers so you can see the overall picture of your investments, not just the ups and downs of daily price changes. Imagine watching a graph that smooths out the wild jumps and dips, letting you focus on long-term growth including dividends and fees that really matter.
There are a few ways to start tracking your investments. You might begin with a free tool like a Google Sheet, which lets you learn the basics while keeping control of your own data. You can also use trackers built into your bank or brokerage, try out apps that update prices in real time, or even go for fully automated tools that handle most tasks for you. Each option has its perks, but don’t forget that missing out on details like dividends can give you a misleading view of your progress.
Common mistakes new investors make include:
- Only paying attention to daily price changes
- Forgetting to consider income from dividends
- Overlooking fees that can impact your returns
Centralized dashboards offer live analytics to help you align your investments with your financial goals. It’s all about planning ahead and making smart moves every day.
Portfolio Tracker Metrics: Basic Investment Data Beginners Must Monitor
Tracking your investments might seem tricky, but a solid portfolio tracker breaks everything down into five simple categories. Think of each as a piece of a puzzle that, when put together, shows how close you are to your financial goals.
Performance metrics come first. They tell you how much profit you’re making overall. For example, if you buy a stock for $100 that later becomes worth $110, plus you earn $5 in dividends, your total profit is $15. This number helps you see if your investments are steadily growing.
Next is asset allocation. This shows how your money is divided among stocks, bonds, and other investments, kind of like sorting your money into different jars. Getting the right mix is key to sticking to your strategy.
Then there’s the income you earn from dividends. These regular payments are important because they add extra value to your investments over time. Picture them as a steady boost that supports your long-term plan.
Fees and expenses matter too. Even small fees add up over the years. For instance, a 1% annual fee on a $10,000 investment could cost you over $6,600 across 20 years if you’re earning a 7% return. Keeping an eye on fees helps protect your hard-earned profits.
Finally, tracking tax implications is a must. Understanding what you owe in taxes can change how much you actually make from your investments. Some tools even adjust for deposits and withdrawals so you get a clearer picture of your returns.
Portfolio Tracker Apps: How to Choose and Configure Your First Tracker
When picking your first tracker app, look for one that shows data in real time, sends you customizable alerts, spells out fees clearly, and works smoothly on your phone. These features help you keep up with your investments and avoid missing important market moves. For example, apps that update live let you see the latest prices, while alerts can let you know the moment your asset hits a key number.
Start by linking your brokerage accounts so all your investments are in one spot. Some apps let you connect more than one account, giving you a full picture of your finances. Think of it like putting all your ingredients on the counter before you start cooking, you see everything at once and it makes tracking your progress a lot easier.
Next, set up simple visual cues on your dashboard. You might use a little color-coding in your tracker or linked spreadsheet so gains show in green and losses in red. This quick glance check works wonders, almost like having a built-in mood ring for your portfolio. Many modern apps let you arrange the dashboard your own way, sorting data by asset type or highlighting the info you think matters most.
Some platforms even toss in AI-powered insights, like PinkLion does, to analyze trends for you automatically. It’s a bit like having a knowledgeable friend whisper smart investment tips when the timing’s right. Try a few different apps and see which layout feels natural to you, letting your tracker simplify your routine while keeping all that key data right at your fingertips.
Portfolio Tracker Tool Showdown: Comparing Top Beginner-Friendly Platforms
Check out the table above. It lays out some top portfolio tracking tools that are easy to use, even if you’re just starting out. Each option is broken down by its key feature, price range, and mobile access, making it simple to zero in on what matters most to you.
Maybe you’re drawn to Mezzi because it uses smart AI to track your investments in real time. Or perhaps Stock Rover grabs your attention with its detailed analysis of thousands of stocks and ETFs. Then there’s Tickeron, which employs AI to spot trends across crypto, forex, and stocks, helping you see patterns that could guide your choices.
If you’re into backtesting your strategies, Portfolio123 offers a robust engine that covers loads of stocks and funds. And if staying eco-friendly while managing your portfolio appeals to you, Ziggma’s focus on ESG tracking with smart alerts might be the perfect match.
Delta by eToro combines different assets in one dashboard, along with pattern-recognition tools, while Firstrade offers commission-free trading paired with AI analytics for those thinking about retirement. Lastly, TC2000 mixes in real-time trading tools at various pricing levels, all accessible on both web and mobile.
Take a moment to review this friendly guide. It’s like a quick chat that helps you find a platform that fits your style and needs, whether you’re tracking with your phone on the go or diving deep into data at home. Enjoy exploring your options as you set up your investment journey!
Portfolio Tracker Analysis: Simple Techniques for Evaluating Your Portfolio
A portfolio tracker does a lot more than simply show you daily price changes. It helps you set clear money goals, plan a smart strategy, and make trades with purpose. Instead of getting caught up in tiny ups and downs, you can use it to fine-tune your mix of assets.
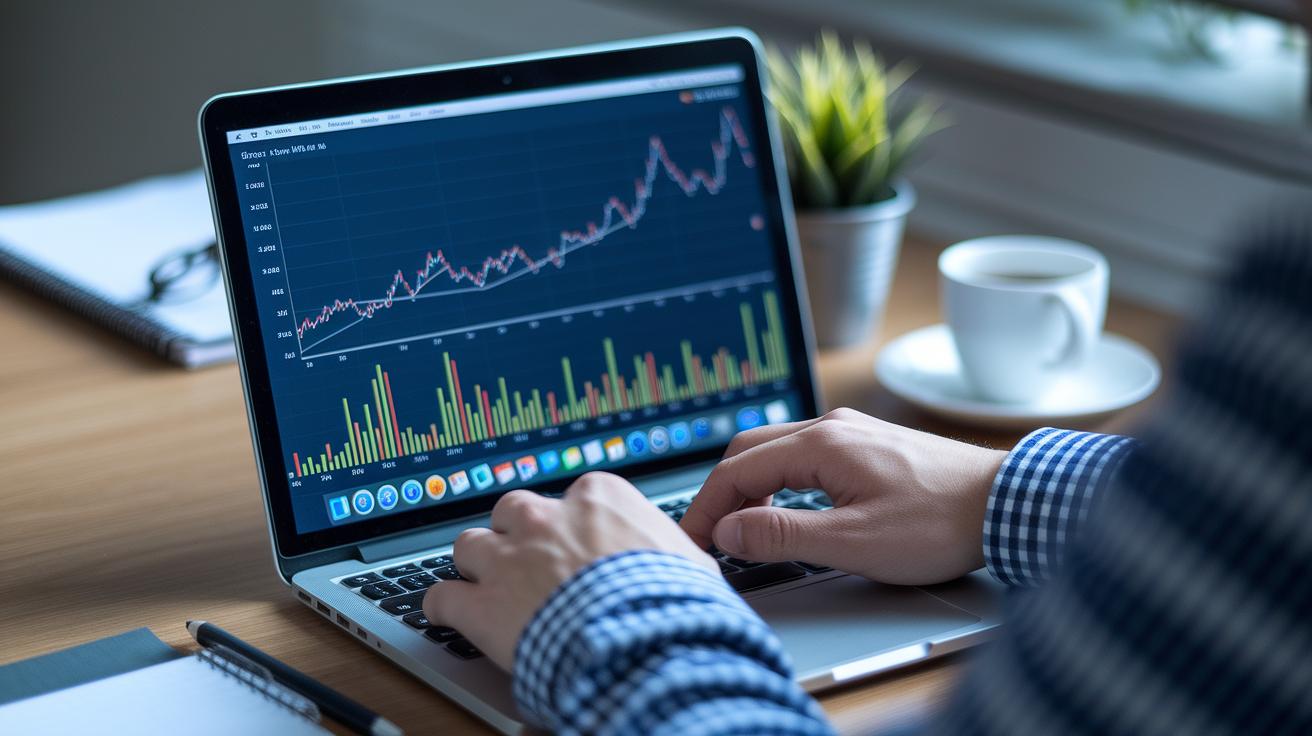
Picture looking at a line chart that shows long-term trends, like a stock steadily rising over several months. This lets you spot real opportunities without getting lost in everyday noise. For example, think about an asset that grew 5% in a month even though its daily numbers jumped around. It’s a clear reminder that long-term trends often matter more than the minute-to-minute fluctuations.
Here are a few mistakes to avoid:
- Obsessing over daily swings and getting anxious about small dips
- Overlooking how reinvested dividends can boost your returns
- Allowing quick market changes to steer your overall plan
Try setting up alerts that notify you when key numbers change, such as a specific price drop, a shift in valuation, or changes in yield. These alerts help you stay on top of important moves without having to watch every little detail all the time. Plus, using easy-to-read visuals like bar graphs or line charts makes it simpler to see those big-picture trends and understand your portfolio’s overall performance. This way, you can focus on steady growth without getting sidetracked by short-term market noise.
Final Words
In the action, we broke down how to build your own portfolio tracker, from setting up columns and live price feeds to applying conditional formatting for quick insights. We shared simple steps and clear examples to keep you informed about key metrics and tracking tools. Use this portfolio tracker for beginners guide as your stepping stone to better risk management, smart analysis, and secure practices. Stay positive and let your growing confidence guide you toward smarter investment decisions.
FAQ
Frequently Asked Questions
Q: What are some free portfolio tracker options for beginners using Excel or Google Sheets?
A: The free portfolio tracker for beginners in Excel or Google Sheets offers a simple DIY solution, using columns for tickers, shares, prices, and gains. It lets you easily update and view your investments.
Q: What is the best way to keep track of a portfolio?
A: The best way to keep track of your portfolio involves using a tool or spreadsheet that monitors key metrics like share counts, prices, and profit/loss in real time, making review and adjustments straightforward.
Q: What is the 7% rule in investing?
A: The 7% rule in investing uses a benchmark of a 7% annual return, providing a standard against which fee impacts and long-term portfolio performance are measured, and guiding investment comparisons.
Q: What is a good portfolio for a beginner?
A: A good portfolio for a beginner usually includes a diversified mix of low-cost index funds, bonds, and select stocks. This balanced mix aligns with risk tolerance while offering steady growth potential.
Q: What is the 12/20/80 rule?
A: The 12/20/80 rule in investing serves as a guideline for balancing risk. It suggests allocating a small portion to safer assets, a moderate share to income-generating investments, and most funds to growth-focused securities.