Ever wondered if there's more to Apple's stock jump than meets the eye? Apple shot up from $165 to more than $230, kind of like a boat catching an extra strong wind.
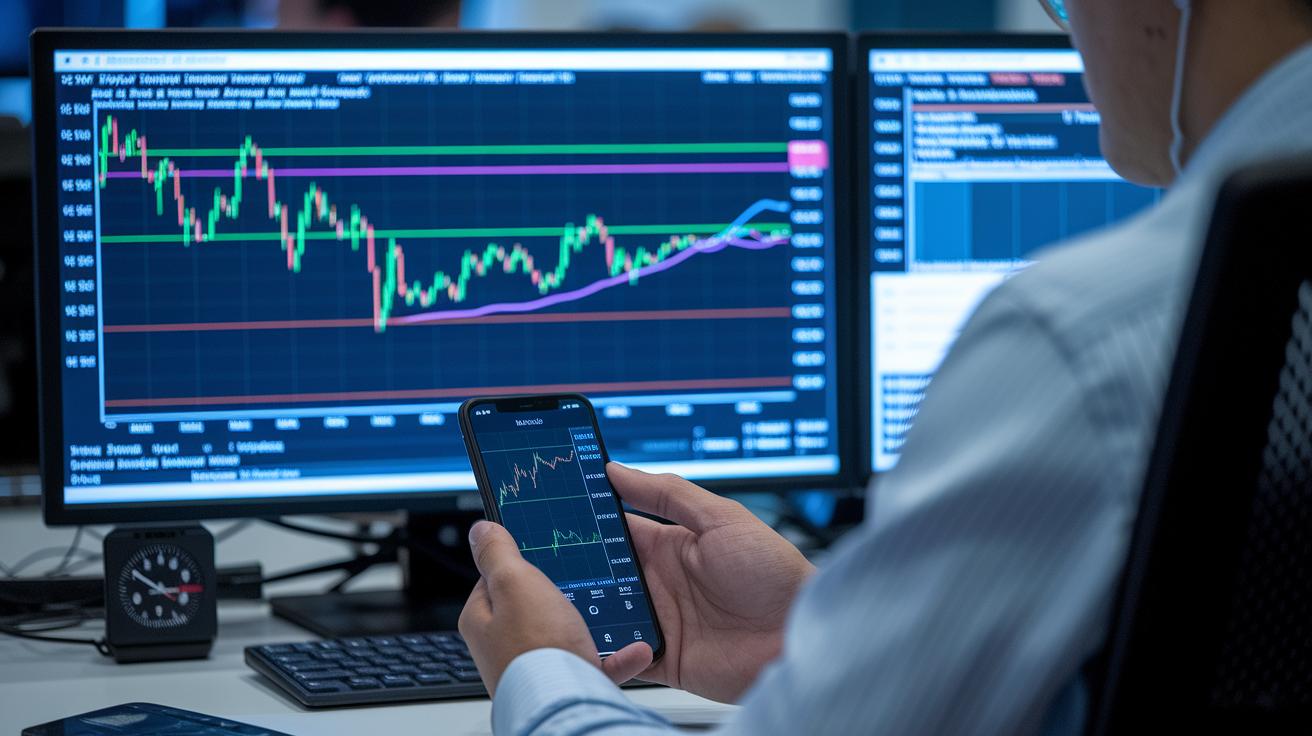
In this chat, we'll unpack what the charts are telling us. We look at things like moving averages (which show a stock's average price over a set time) and trading volume (the total number of shares bought and sold).
Strong buying interest is driving this rise, even as tough resistance levels hint that there might be some hurdles ahead. Step by step, we'll explore what this momentum might mean for Apple’s future.
Comprehensive Technical Analysis Overview of Apple Stock Performance

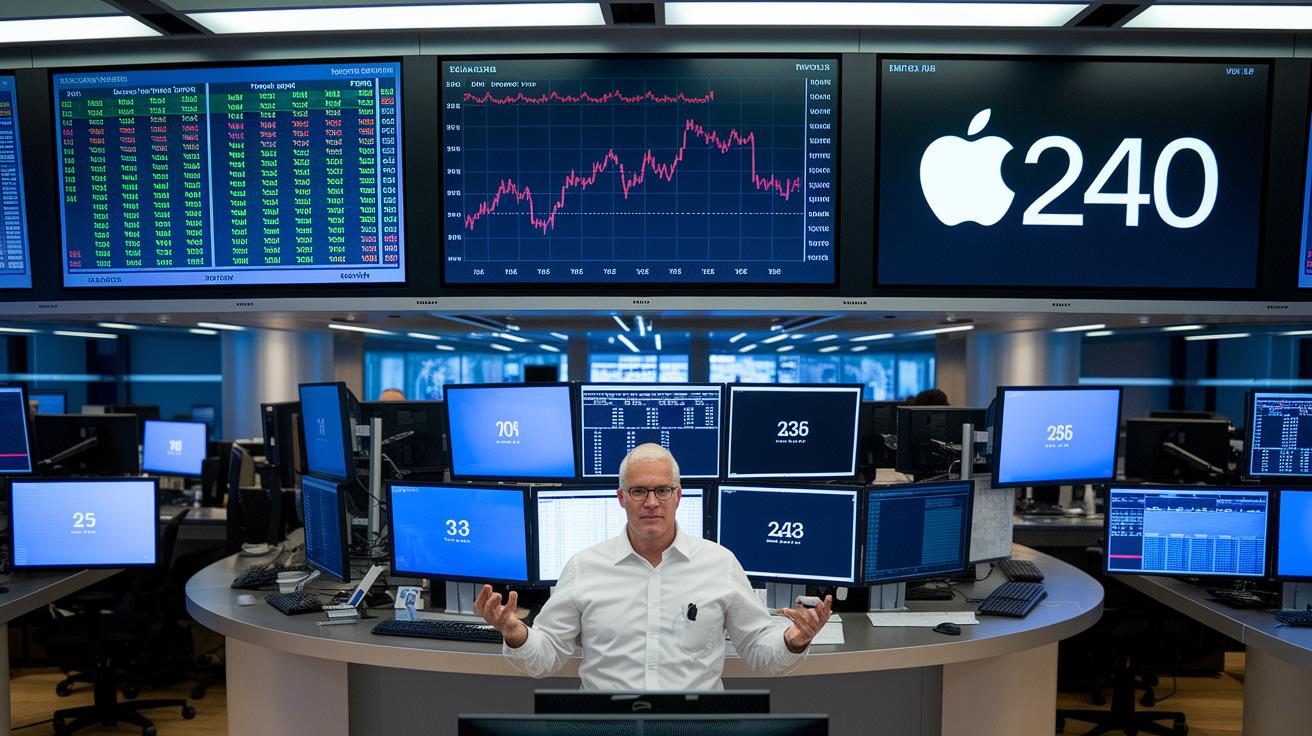
Apple stock has taken off, jumping from about $165 to over $230, a solid 36% rise that shows real buyer strength. Picture it like catching a sudden gust of wind that pushes your sailboat ahead. The short-term moving averages are still sitting above the long-term ones, a usual sign that the market mood is upbeat.
This surge wasn’t just a fluke; there was plenty of trading volume behind it, which means the climb was driven by real buying interest, not just a slow drift upward. Look at the charts, and you'll see it wasn’t a one-time spike but part of a steady buying trend. That said, there’s some heavy resistance between $235 and $240, with previous push-backs around $260. If Apple can’t break beyond $260, we might see a lower high, a pattern similar to what happened back in February and July 2024.
Experts lean on these technical tools to decode the market’s mood. By combining volume analysis, the behavior of moving averages, and key resistance levels, they’re able to put together a clear picture of where Apple’s stock might head next. It’s like having a roadmap through the buzzing activity of the market. Have you ever felt the thrill of spotting a sign for the next big move?
Apple Moving Average Analysis for Technical Trends
Short-Term EMA Crossovers
Looking at Apple's moving averages, we can see the stock is on an upward path. The 20-day and 50-day exponential moving averages (EMAs, which put more weight on recent prices) are above the longer 100-day and 200-day simple moving averages (SMAs, which smooth out data over a longer period). This tells us the market is gaining a solid burst of momentum, kind of like a sprinter who picks up speed after a strong start. Have you ever seen your favorite team take an early lead and keep it throughout the game? That's the feeling here.
Long-Term SMA Support Trends
When you check out the long-term averages, there's a steady support base backing Apple's price. The rising trend of the 100-day and 200-day SMAs acts as a safety net during tougher market times. Recently, the stock found firm support around $215, where the 50-day and 200-day averages meet. This level is key because if Apple can’t push past the $260 mark, it might form a lower high, much like patterns we've seen before. Imagine reaching a plateau on a hike, without a strong push upward, progress can stall. Overall, these signals suggest that the uptrend is still in play, even if there might be a few bumps along the road.
RSI and Momentum Indicators in Apple Technical Analysis
Apple’s share price lately shows some clear signs of momentum. The relative strength index (RSI) has been hovering close to levels that many traders see as overbought, meaning the buying power might not last very long. Analysts often look at MACD signals, where the shorter MACD line moves above the signal line, to back up the strong upward trend seen in the exponential moving averages.
Then there’s the Apple stochastic oscillator. This tool helps us spot short-term ups and downs, suggesting that if buying gets too eager too quickly, we might soon see a pullback. Think of it like watching a car’s engine heat up; when the RSI goes above 70 during a sharp surge, it can be a sign that things may need to cool off before speeding up again.
And on top of that, strong trading volume during a rebound tells us the move isn’t just a slow, steady climb, it’s being powered by lots of market action. Traders like to mix these details with other financial tools to figure out if Apple is getting too stretched or if the bullish vibe is still genuine.
Key Support and Resistance Levels in Apple Technical Charts
Apple’s chart paints a vivid picture with its notable price levels. The resistance area between $235 and $240, rising up to around $260, acts like a barrier on a steep hill. Recent moves remind us that when prices dance near this zone, the market might soon break out or slide down. Think of it like approaching a wall where every step is a test of resolve.
Down at the $215 mark, where two important moving averages come together, there’s a strong guidepost. A dip below this line could push Apple into the psychological $200 level, signaling fresh risks. Recent touches suggest that while buyers have been keeping this level in check, a sudden fall might shake investor confidence, almost like a safety net that suddenly feels less secure under extra weight.
| Chart Level | Price Range | New Insight |
|---|---|---|
| Resistance Zone | $235–$240 (up to $260) | The market may hold back or flip direction based on its performance here |
| Primary Support | Near $215 | This level acts as a buffer, but a break could weaken market confidence |
| Psychological Support | $200 | Watch closely if the key support fails, opening more downside risk |
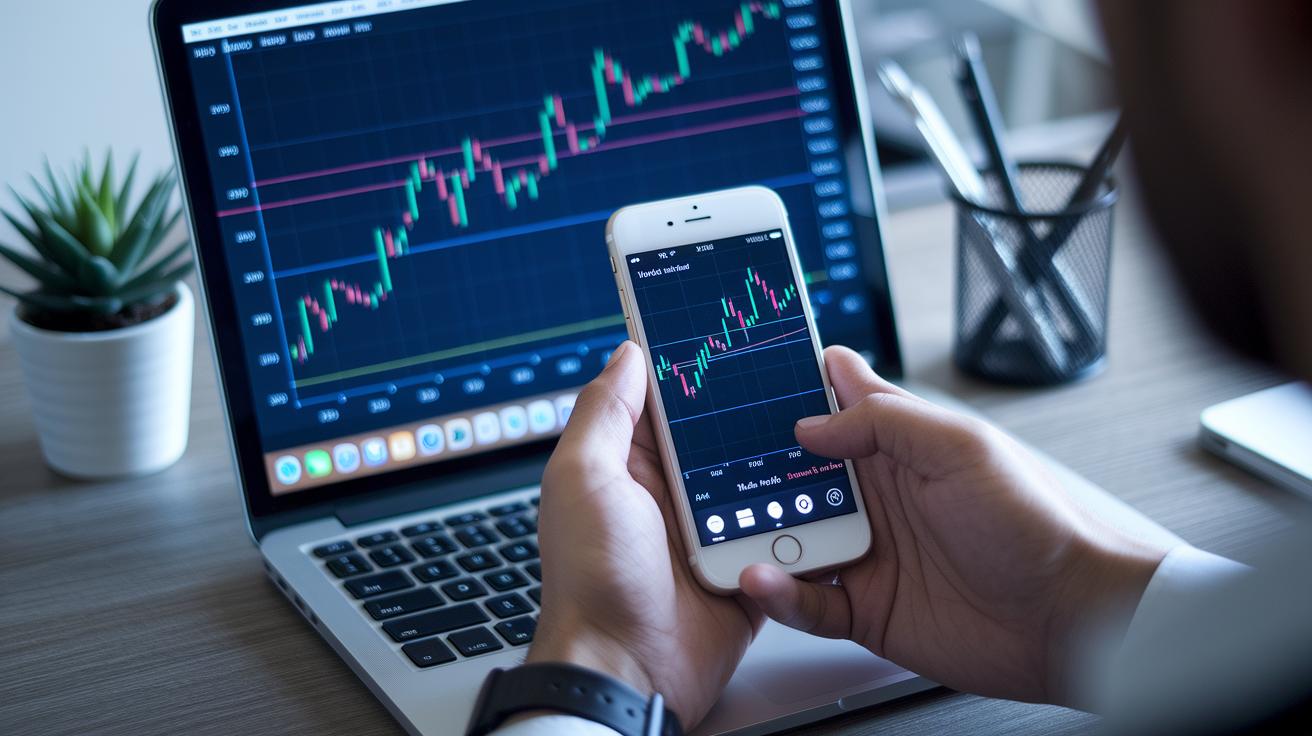
Volume Trends and Price Action in Apple Technical Review

Apple’s stock jumped from about $165 to over $230, and strong trading volume played a big role in that move. For example, when the price broke out, a sudden volume spike, up to 35% above the average, hinted that lots of buyers were stepping in. In one early session, a quick burst of heavy trading even suggested a possible reversal before the price fully reacted.
These busy intraday patterns give more depth to the overall picture. A small drop in volume during key price movements might be an early sign that buying energy is slowing down. And when price jumps line up with these clear volume changes, it’s a strong signal that the buyers are in control.
By zeroing in on these specific examples and noticing the chart patterns as they happen, you get useful clues that add to the broader technical review without repeating the same details.
Apple Chart Patterns and Technical Breakout Strategies
Apple's stock is at a crossroads. The shares need to break through the $235 to $240 range, literally shattering that barrier. A daily close above $240, especially when paired with a strong volume spike, could push the price toward $260, a jump of about 12%. Traders watch these levels like a referee eyes a crucial call during a game.
Reversal Pattern Signals
Sometimes, the chart tells a story. Look for patterns like head-and-shoulders or double-tops. Imagine Apple climbing steadily, hitting a peak, dipping in the middle, then rising on each side, that's a head-and-shoulders pattern hinting that momentum might reverse. Similarly, if the price hits a resistance point twice without breaking through, it might be waving a caution flag. These signals help traders decide when to rethink their entry or exit spots.
Breakout Entry Criteria
Breaking the resistance line isn’t enough to seal the deal. To really consider a trade, Apple needs to finish the day above $240, with volume backing the move. Think of it like waiting for a green light on a clear day before you drive off. That extra burst of volume tells you there’s real buyer interest. Traders often set orders to kick in once Apple exceeds $240, while also keeping an eye on the $215 level as a safety net if things don’t go as planned.
Technical Risk Management and Predictive Signals for Apple

Apple has a high stock price and many owners, which means you really need to manage risks carefully. When looking at technical risk, it makes sense to use clear stop-loss orders placed near the meeting point of the 50 and 200 simple moving averages, around $215, or at the key $200 level to help limit losses. Using Apple predictive analysis (which looks at past trends to help forecast future moves), you can set stop-loss levels so that if the price falls below major support, your losses stay roughly around 15%.
Traders should also think about keeping their positions small in this high-valuation scene. This way, one rough market move won’t hurt your overall portfolio too much. With potential shifts in Fed policy and worries over China’s supply chains, extra risks are in play that could change how the market behaves. And if Apple manages to close above $240, its price might head toward $260, giving you a chance at about a 12% gain.
Smart risk management means planning for different scenarios, whether the stock breaks out or pulls back. It’s all about staying disciplined, adjusting your positions when needed, and setting your stop-loss orders with a clear strategy in mind. This proactive approach is key for managing Apple’s technical risks, balancing the drive for gains with a careful protection of your investments.
Technical Analysis of Apple: Dynamic Market Pulse
When you look at Apple’s charts, you see a mix of solid data and expert opinions coming together. Right now, 31 analysts are urging a "Buy" and have set a 12‑month target around $235.79. In simple terms, they expect the stock to gain roughly 1.57%, a steady, if modest, climb.
The charts tell a friendly story: Apple is showing strong signs of an upward trend. It’s like watching a well-rehearsed play, where the stock steadily makes its move upward, echoing the buzz of a smart, well-timed trade. Yet, there’s a twist. An upcoming event, the iPhone 17 launch on September 9, 2025, could shake things up. This event might spark a flare of optimism with strong hardware sales, or it might trigger a "sell-the-news" move that cools the market's excitement.
This blend of clear chart signals and big future events creates a lively, real-time picture of Apple’s market vibe. Traders use these insights to adjust their stop-loss orders and position sizes, balancing the thrill of potential gains with a cautious eye on risks. It’s a bit like tuning into your favorite song, where every beat and pause tells a part of the story.
Final Words
In the action, we explored key moving averages, momentum indicators, and volume cues that shaped Apple’s price action. We broke down support areas, resistance limits, and chart patterns that hint at potential breakouts and reversals. We also discussed essential risk management tactics to keep trades secure. This technical analysis of apple lays out a clear map for reading market trends and making informed decisions. Stay optimistic as you use these insights to fine-tune your investment strategies.
FAQ
What does technical analysis of Apple pdf cover?
The technical analysis of Apple presented in a PDF details recent price movements, trend signals from moving averages, and volume patterns, offering a clear snapshot of key support and resistance levels.
What does technical analysis of Apple stock and its stock price show?
The technical analysis of Apple stock focuses on chart patterns, moving averages, and oscillators to identify momentum, highlight bullish trends, and signal potential reversal points.
What information does the Apple 200-day moving average chart provide?
The Apple 200-day moving average chart displays long-term trend dynamics, pinpointing major support zones and indicating whether the overall trend leans upward or downward.
What insights does MSFT technical analysis offer?
The technical analysis of MSFT stock uses similar methods to Apple, examining moving averages, RSI, and volume patterns to measure market momentum and inform trade decisions.
What does AMZN technical analysis involve?
The technical analysis of AMZN stock reviews chart patterns, key resistance levels, and momentum indicators like the RSI to interpret market moves and identify trading opportunities.
What does Apple RSI on Yahoo Finance indicate?
The Apple RSI on Yahoo Finance reflects momentum readings, helping investors determine if the stock is overbought or oversold, which is essential for assessing short-term market strength.
What is meant by the Apple stock support level?
The Apple stock support level refers to price areas where buyers typically emerge; current analysis identifies support near the convergence of the 50-day and 200-day moving averages.
Is Apple bearish or bullish based on technical analysis?
The technical analysis of Apple shows bullish signals through rising moving averages and strong volume trends, suggesting a generally positive market sentiment despite certain resistance levels.
What if I invested $1,000 in Apple 20 years ago?
A look back at Apple’s technical performance indicates that a $1,000 investment 20 years ago would have appreciated significantly, reflecting the long-term strength of its market trends.
Will Apple stock reach $700 again?
The technical analysis does not conclusively predict Apple reaching $700 again, as price targets depend on breakout signals, sustained buyer interest, and broader market confidence.
Who is the king of technical analysis?
The designation of “king of technical analysis” is subjective; many experts provide valuable insights, and no single analyst is recognized as having sole authority in chart-based market predictions.