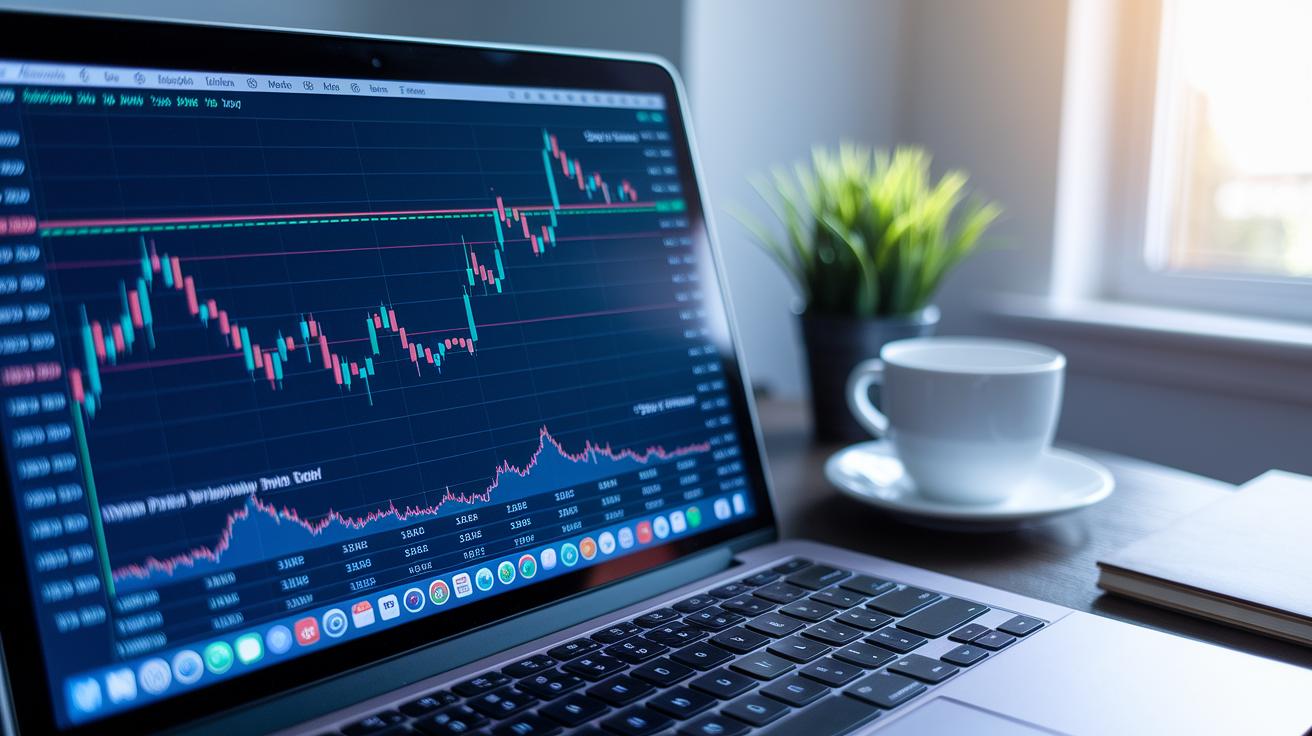
Ever noticed how charts sometimes hint at what’s coming next? Technical analysis is like following a map made from past price moves. It looks at little changes in price and volume – think of them as clues – that can point us toward future trends.
In this post, we’ll chat about how these simple signals help traders make smarter decisions in the busy world of finance. You'll see how basic tools turn everyday movements into clear clues that guide your investment steps.
Ready to rethink the way you see investing? Let’s explore how tuning into these smart trends might open up a whole new perspective on managing your money.
Foundations of Technical Analysis in Financial Markets
Technical analysis digs into past price data and trading volumes using charts and basic tools to guess where prices might go next. It looks at how the market behaved before, using clear signals like trends, patterns, and volume changes. For example, before a price rally, some traders noticed small, step-like bumps in prices that built up gradually, hinting a bigger move was coming.
This method is different from fundamental analysis, which focuses on earnings and sales numbers. Instead, technical analysis keeps its eye on price and volume patterns to capture the push and pull of supply and demand. Traders use these clues to understand the market's steady beat and get ready for any shifts ahead.
This approach works across many markets, stocks, commodities, currencies, and futures. It’s built on the idea that past price action holds hints about what might happen next. Think of charts as maps that show market highs and lows, helping traders decide when to jump in or step back. In short, technical analysis turns everyday market moves into clear signals that can guide smart, timely investment choices.
Chart Types in Technical Analysis of Financial Markets
When it comes to keeping an eye on market trends, picking the right chart is like choosing the best tool for the job. Imagine a line chart as a simple drawing that shows closing prices over time, it gives you a clear picture of the overall trend in a quick, friendly way.
Bar charts, on the other hand, add more flavor by showing not just the closing price, but also the opening, high, and low prices for a given period. This extra detail can be really helpful in spotting daily price changes and understanding how much a market might be bouncing around.
Candlestick charts, which have their roots in Japan, use colored blocks and lines (or wicks) to represent price movements during each period. They let you quickly see when a trend might reverse or keep going. Then there are point & figure charts. These focus solely on price moves, ignoring time and volume, so they help cut through the usual market clutter and spotlight real shifts.
Using a mix of these charts helps traders build a complete picture of market mood, guiding them when to jump in or step back. Next, here’s a quick glance at the main differences between these chart types:
| Chart Type | Key Feature |
|---|---|
| Line | Shows closing prices over time for overall trends |
| Bar | Displays open, high, low, and close values for each period |
| Candlestick | Uses colored blocks and wicks to visualize price action |
| Point & Figure | Focuses on price movement by ignoring time and volume |
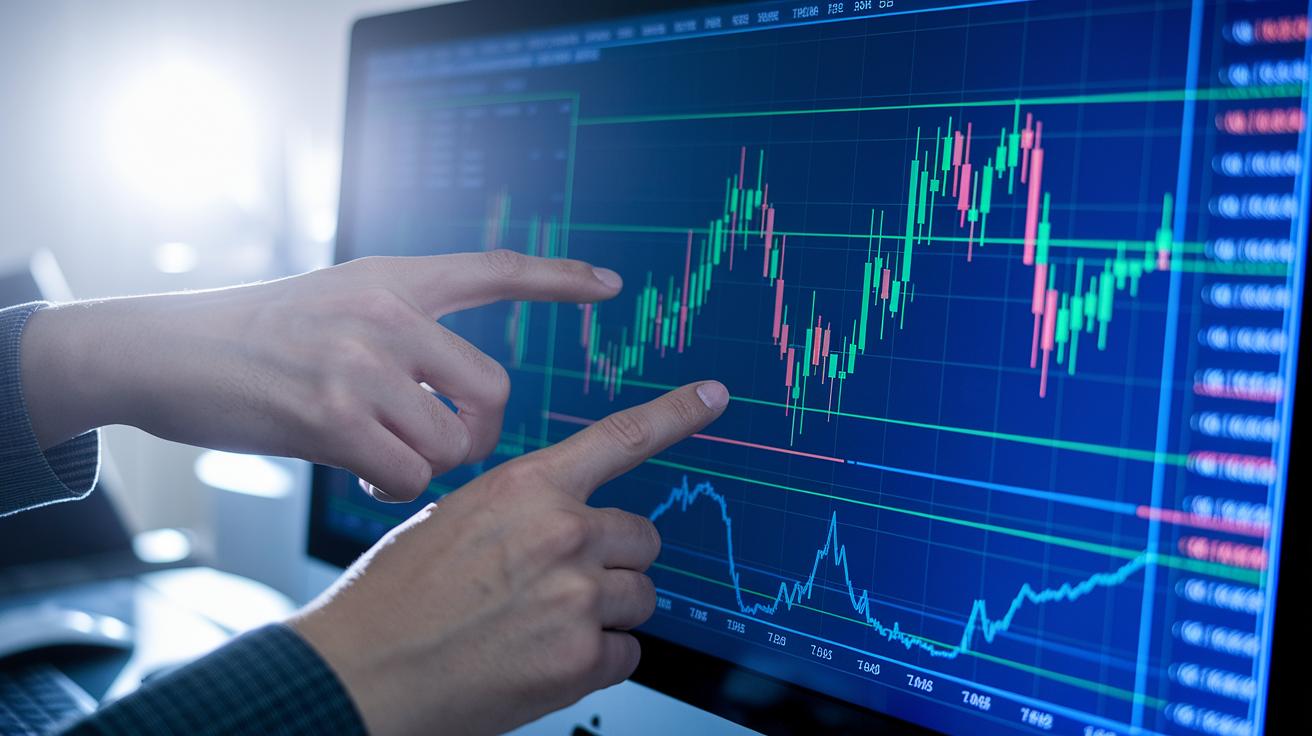
Key Technical Indicators for Market Momentum and Trend Analysis
Technical indicators are like trusted friends in trading, helping you see the clear signals amid the constant buzz of market data. They take raw numbers and turn them into easy-to-understand clues about how prices are moving. For example, when moving averages change direction, it might mean an asset is on the rise or starting to drop. This way, decisions to buy or sell aren’t made on a hunch but on real, measurable trends.
These tools aren’t magic predictors on their own; think of them as essential pieces in a larger puzzle. They break down the complex rhythms of the market by highlighting patterns in price changes and trading volumes. And when you put together insights from indicators like oscillators or volume analysis, you can often spot early signs of a trend reversal. It’s a method that grounds trading decisions in observable behavior, turning uncertainty into actionable insights.
Below are some key indicators many traders use:
- Simple Moving Average (SMA)
- Exponential Moving Average (EMA)
- Relative Strength Index (RSI)
- Moving Average Convergence Divergence (MACD)
- Bollinger Bands
- Trading Volume
Mixing these indicators gives you a fuller picture of market movements. For instance, if the RSI shows an asset might be overbought while the MACD hints at slowing momentum, a trader could see that as a signal for a possible reversal. Similarly, if a steady price increase is confirmed by rising trading volume and moving averages, it reinforces the idea to stick with the current position. By cross-referencing several signals, traders can better filter out false alarms and manage risks, making their strategies both robust and responsive.
Chart Pattern Formation and Price Action Techniques in Financial Market Analysis
When you're trading, you want to know when the market might be shifting. Reversal candlestick patterns help signal these turning points. For example, take the bullish engulfing pattern. Imagine a small red candle being completely covered by a larger green one. This simple picture tells you that buyers might be taking control, hinting that the market could be turning upward.
Another cool pattern in play is the rising three methods pattern. It kicks off with a strong, tall green candle that sets the stage. Then, a few smaller candles show a pause, like a moment of calm before the storm. Finally, a robust candle breaks out above the earlier levels, confirming that the trend is likely to continue. It’s a handy signal for swing traders when the market shows a mix of steady climbs and brief pauses.
Price formations are just as important when it comes to deciding your entry and exit points. Think of it like measuring how far a price might move once you see a pattern. When these formations line up with clear candlestick cues, they help you judge the risk and set real targets. In short, using both chart patterns and price action clues can turn what you see on the screen into practical trading insights.
Identifying Support, Resistance, and Fibonacci Levels in Market Charts
Support and resistance zones are simple but powerful ideas. They are horizontal areas on a chart where the price has reacted before. In plain terms, support is like a safety net under a high dive, when a price falls, it often bounces back up at this level. Resistance works the other way. When the price hits a certain point from below and then falls, that level acts as a barrier. And sometimes, if resistance is broken, it can flip into support, giving traders a hint on when to jump in.
Fibonacci retracements add another layer to this picture. They use common points like 38.2% and 61.8% to mark out where a price pullback might pause. After a big move, traders draw these levels to see where the bounce could happen. For instance, if a falling price touches the 38.2% level and then stops dropping, it might mean the decline is losing steam. When both the 38.2% and 61.8% levels get tested, it signals that the momentum could be fading, which might be the right time to act. This clear setup helps guide when to tighten up stops or add to a position, making market moves a bit easier to predict.
Using Trend Lines, Channels, and Market Geometry in Financial Market Technical Analysis

Trend lines work by drawing a straight path through the lowest points during an uptrend or the highest points when prices are falling. Picture it like outlining the bottom edge of a staircase. When prices hover close to that line, it signals steady momentum; but if prices break away from the line, it could mean the market mood is shifting. For example, a sudden drop below an uptrend line might be a sign of an upcoming reversal.
Channels build on this idea by using a pair of parallel lines to mark the boundaries where prices typically move. Think of it as a road with clear borders on both sides, if the prices stay within these borders, the trend holds. But if prices break out, it could signal that a new trend is on the horizon, opening fresh opportunities for trading.
Market geometry adds a different angle by comparing the strong moves (impulses) with the pullbacks (corrections). Using a simple method like the 1:1 structure, traders can get a feel for where prices might go next. For instance, if the size of the upward move is about the same as the following drop, it might just be a pause before the market gains momentum again. Together, these techniques turn raw price data into clear signals for traders.
Managing Risk and Interpreting Trading Signals in Technical Analysis
When you dive into market analysis, it’s important to remember that no technical indicator is foolproof. Even the best tools can give off mixed or false signals, especially in quieter markets. Savvy traders know how to protect their money by using practices like stop-loss orders and careful position-sizing. For instance, if you spot a false breakout, a quick price jump that fizzes out, a stop-loss order can help you dodge heavy losses. Assets that trade with lots of buyers and sellers generally show clearer signals, while those with less liquidity might trick you into acting on false cues. In short, filtering through these signals carefully helps you balance risk with the chance for reward by leaning on trends that are truly proven.
When you’re reading trading signals, it pays to look at more than one indicator to make sure you’re on the right track. Seeing a bounce in a candlestick chart might be interesting, but pairing that with other signals like a moving average shift or a surge in trading volume can really boost your confidence. Imagine you’re watching for a breakout; if you also notice that the relative strength indicator is confirming the move, you have a firmer basis for your decision. This method cuts down on false alarms and helps you pick the best times to jump in or step back, keeping your trading smooth and in control.
Advanced Software Tools and Automated Systems for Technical Analysis of Financial Markets

Today's trading platforms and APIs are like a quick, reliable heartbeat for the market. They let you execute orders fast and tailor them for a host of instruments, whether it’s stocks, futures, options, commodities, currencies, or CFDs. These handy systems bundle advanced chart tools with automated signal alerts that give you a clear sense of market movements. With over 23 years of know-how, the providers deliver user-friendly toolkits and timely market news that guide both day traders and long-term strategists.
Beyond the basics, these automated systems and algorithm-driven charts are giving traders a fresh way to work. They bring real-time data and even predictive insights directly into your trading routine. For example, platforms like financial tools show you how smart integrations can mix automated signals with dynamic charts, helping you spot trends and pinpoint just the right moments to enter or exit a trade. By sifting through heaps of historical and current data, these tools turn complex market shifts into simple, clear notifications. This blend of automation and human insight helps you stay nimble and confident, even when market conditions change fast.
Final Words
In the action, we explored how historical price data and chart patterns guide smart moves. We covered chart types and technical indicators, supporting traders to pinpoint trends and spot key trading signals.
The insights spoke to both risk management and using modern software tools for secure, practical analysis. This comprehensive look blends clear price action techniques with actionable strategies, empowering you with the benefits of technical analysis of the financial markets.
Keep building your skills and trusting your process, there’s always a way to make your trades count.
FAQ
Where can I find “Technical Analysis of the Financial Markets” PDFs, downloads, and reviews?
Questions about the book by John Murphy often seek PDFs, free downloads, reviews, or versions on Google Drive. Many online sources offer options but always confirm legal and authentic copies before accessing.
What is technical analysis of the financial markets?
Technical analysis uses historical price and volume data from charts to forecast market moves. It focuses on past price behaviors, helping traders spot trends without analyzing company fundamentals.
Is technical analysis of the financial markets still relevant today?
Technical analysis remains relevant as it provides insights into market trends through price and volume patterns. Traders benefit from its ability to signal potential movements in the ever-active financial markets.
What is technical analysis of the financial markets AI?
This approach applies artificial intelligence to analyze price patterns, speed up chart reading, and recognize trends quickly. It augments traditional methods by offering faster, data-driven insights.
What is the golden rule of technical analysis?
The golden rule relies on price and volume data, with the idea that historical price patterns often reappear. This principle guides traders to focus on proven chart signals for solid market insights.