
Have you ever thought one tool might transform how you choose stocks? A US stock screener shows you more than 5,525 stocks all at once. It presents simple details like dividend yields and market ratios, making it easier for you to find the right ones.
This tool updates as the market changes, almost like having a live guide by your side. Imagine it as a friend who spots promising investment choices in real time. Once you try it, you might see your investment approach in a whole new light.
US Stock Screener Inspires Smart Investing
A US stock screener is a handy tool that makes finding stocks easier. It checks over 5,525 US stocks without any limits, so you can really explore your options. Think of it as your starting point for spotting smart investments using simple, clear numbers. For example, if you set a filter for a dividend yield of at least 3%, you quickly uncover new income opportunities.
It also offers key filters that cover lots of financial details. You can see basic factors like market cap, the price-to-earnings ratio, dividend yield, debt levels, earnings growth, and revenue. It even covers trading volume and price moves to give you a live picture of the market. Imagine setting up a filter with no lower price limit so that even emerging stocks make the list.
The screener updates in real time, showing both short-term and long-term trends like income ratios and debt-to-equity levels. As market conditions change, these numbers refresh to match your search, helping you find stocks that fit your criteria. In short, this tool acts like a real-time value detector that guides you toward smart, data-driven choices.
Comparative Table of Free vs. Premium US Stock Screeners
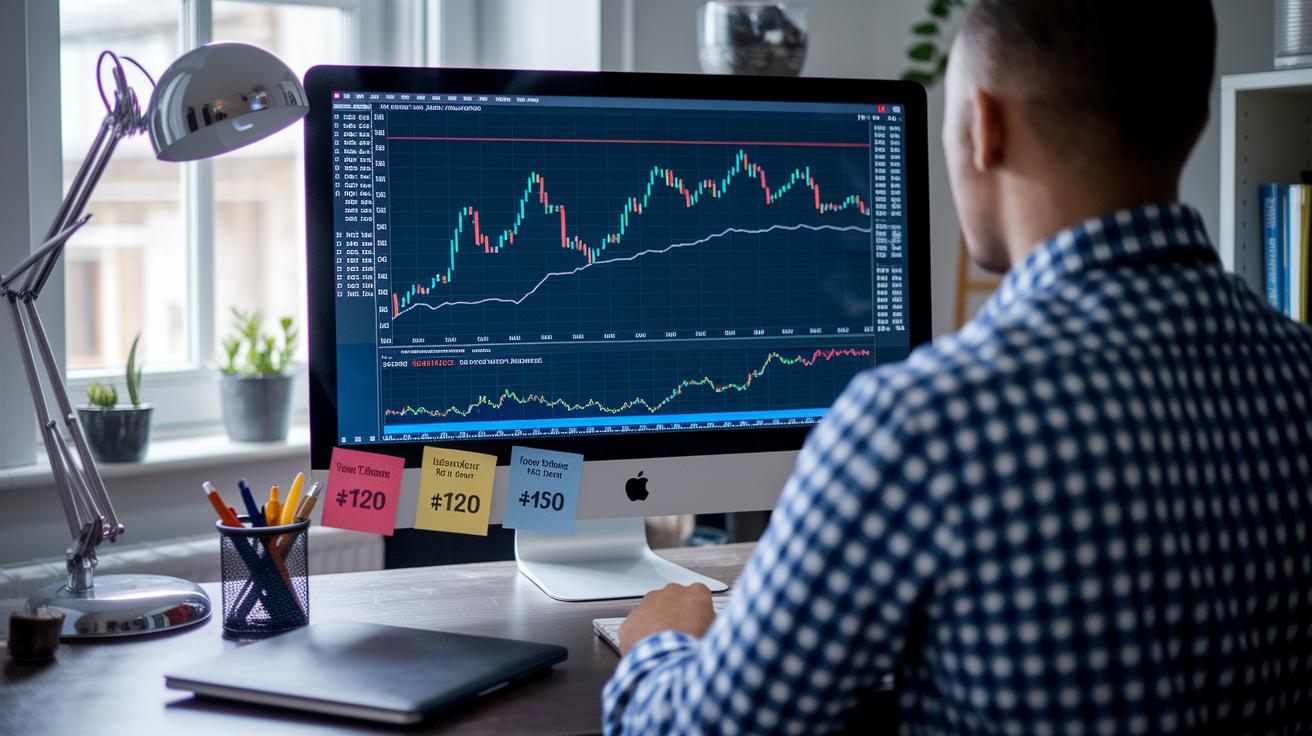
When you're picking a stock screener, it helps to find one that fits your personal investing style. Some platforms let you explore lots of features for free, while others offer deep tools like long-term financial data and smart, AI-driven insights. Free screeners are like cost-free trading tools that provide the basics, think filters for dividend stocks, market indexes, precious metals, and rate tracking.
Premium screeners, on the other hand, go a step further. They combine old and new data, offer real-time alerts, and use advanced software to give you a closer look at market performance. Have you ever felt more confident when you have all the details at hand? The table below lays out the key differences in pricing, features, and data depth so you can decide which tool best matches your portfolio needs.
| Screener | Price | Key Features | Data Depth |
|---|---|---|---|
| Basic US Stock Screener | Free | Essential filters, real-time updates | Recent data only |
| Popular Free Screener (e.g., Finviz) | Free | Basic market filters, dividend screening | Limited historical data |
| Competitor 2’s Free Tool | Free | Dividend stock screening, market indexes, precious metals, exchange & interest rates | Moderate historical data |
| Competitor 3 Premium Screener | Premium | 10 years of financial query data, Screener AI, commodity price history, >1% shareholder search, company announcements & alerts | Decade-long data with enhanced analytics |
Technical and Fundamental Analysis Tools in US Stock Screeners
US Stock Screeners do a lot more than just crunch numbers. They mix chart signals with a company’s financial health so you get clear insights. This tool brings together real-time market reactions with basic financial checks, letting you see trends while also judging if a stock is priced right. It’s like connecting the feel of the market with the hard facts behind a company.
On the technical side, you get familiar indicators like the RSI indicator (which helps you see if a stock might be overbought or oversold), MACD evaluator, Bollinger Bands monitor, moving average checker, volume-price analyzer, and breakout detection. These tools let you track market momentum and figure out potential price moves. For example, if the RSI shows a stock could be overbought, it might be a sign that things are about to change, almost like spotting the perfect moment to catch a wave.
Then, there’s the fundamental analysis part. This module takes a close look at a company’s key financial statements, think income, debt ratios, earnings growth, dividend performance, and balance sheet details. In simple terms, it’s a health check-up for a company. By combining these profitability and stability metrics, you get a straightforward picture of a company’s financial strength and growth outlook. This clear view helps sharpen your investment decisions with a solid, data-driven approach.
How to Use a US Stock Screener: A Step-by-Step Guide

Pick the US stock screener that fits your investing style. Think of it as your digital partner that filters and analyzes stocks for you. Choose one with at least 10 years of financial data and an easy-to-use layout to help you build a personal plan with confidence.
Next, set out your filter options based on key financial details, how easily assets can be turned into cash (liquidity), and technical signals like trends or price patterns. For example, you might set criteria for dividend yield, market cap, or earnings growth. You can even add a filter that looks for stocks with at least 1% shareholder ownership to catch those promising opportunities.
Then, decide on your specific investment limits. Set clear minimum and maximum values for important measures like the price-to-earnings ratio, trading volumes, and revenue figures. This step fine-tunes your tool, ensuring that you only see stocks that match your goals for smart, informed choices.
Mix both technical signals and the fundamentals of a company for a well-rounded view. You might combine indicators like the Relative Strength Index (RSI), moving averages, and volume checks with metrics such as debt ratios, income, and earnings growth. This balanced approach helps your screener act like a keen financial guide, ready to point out the best real-time market cues.
Run the screen and take a close look at the results spanning a decade of data. Use features like Screener AI to review company reports, spot trends in commodities, and see shifts in the market. As you study what comes up, tweak your filters to keep your approach effective and timely, just like adjusting your sails on a windy day.
Finally, save your custom screen and set up alerts for company news or when key numbers hit your set limits. This way, you're always in the loop on any major market moves. Your stock screener becomes a dynamic, interactive tool that keeps your investment strategy fresh and ready for smart trading moves.
Leveraging AI and Alerts in US Stock Screeners
The Screener AI goes through hundreds of documents like earnings reports, filing updates, and disclosure statements. Think of it as a digital detective that looks for key clues in company files. It picks up on changes and important signals that help you adjust your investment strategy. For instance, imagine it reading a report and then letting you know with a simple message such as, "Alert: Earnings trend shift detected."
Alerts also give you a real-time advantage. They notify you right away about company news, insider moves, or when a set threshold is met. This means you get the information you need exactly when you need it. And if you opt for the premium version, you benefit from quicker processing and even deeper data analysis, including tracking commodity prices.
Best Practices for Crafting Effective US Stock Screens

Start with a clear goal. For example, one investor decided to find mid-size companies that boost their dividends by more than 5% every year. Before diving into larger investments, he only looked at companies with a steady history of raising dividends, which led him to smart picks.
Next, narrow down your search by setting limits on market cap and liquidity. One trader did this by filtering out stocks until only those worth over $1 billion remained. It’s like sorting through a messy list to find only the ripest fruit.
Then, mix technical signals with basic company facts. One method combined chart trends, like an upward rise in the Relative Strength Index (RSI, showing how fast a stock is gaining momentum), with solid earnings growth and low debt. Picture a stock whose charts and balance sheet work together, giving you more confidence in your decision.
Also, update your filters regularly to keep up with market changes. One trader reviewed his screen outputs every quarter and adjusted his settings to match current conditions. Think of it as tuning up your investment engine so it runs smoothly no matter how the market shifts.
Finally, save and test your screening results against past market data. This backtesting helps you see which screens have consistently picked strong performers. Envision checking your choices with history to know which strategies really stand the test of time.
Final Words
In the action, we examined how a us stock screener shapes your investing tactics by filtering through over 5,525 US stocks with clear technical and fundamental indicators. We compared free versus premium tools, walked through a step-by-step setup, and highlighted real-time alerts and AI features.
Each section showed how smart filters and risk management strategies can streamline your investments. Keep refining your screens and feel good about each positive move you take.
FAQ
What is a free US stock screener?
The free US stock screener offers basic filtering tools for US stocks without any fees, letting you quickly find stocks based on criteria like market cap, trading volume, and dividend yield.
What does a live US stock screener provide?
A live US stock screener provides real-time updates and actionable metrics, enabling investors to monitor market movements and quickly adjust their strategy based on current data.
What makes the best US stock screener?
The best US stock screener combines advanced filters, real-time data, and a user-friendly setup, making it easier to spot opportunities with both technical and fundamental analysis.
How does a US stock screener app work?
A US stock screener app lets you build custom screens, receive alerts, and access live market data—all on your mobile device—so you can track stocks anytime, anywhere.
How does TradingView compare as a stock screener?
TradingView offers integrated charting and screening tools that allow investors to view detailed technical setups alongside real-time market insights, making the analysis process smoother.
Is Yahoo Finance a good option for a stock screener?
Yahoo Finance provides a straightforward stock screener with accessible filters for basic analysis, ideal for investors who need free and easy-to-use market insights.
What are the benefits of using a custom stock screener?
A custom stock screener lets you set specific criteria like market cap or dividend yield, tailoring your search to match your investment goals and ensuring you see the stocks that meet your needs.
How do stock screeners with alerts improve investing?
Stock screeners with alerts notify you immediately when your set criteria are met, helping you act quickly on potential opportunities and stay updated with market changes.
What features does the Morningstar stock screener offer?
The Morningstar stock screener provides detailed fundamental analysis along with comprehensive metrics, making it useful for investors seeking in-depth evaluations and long-term insights.
Where can I find a top US stock screener?
Top US stock screeners offer robust filtering, real-time data, and easy navigation, equipping investors with the tools to make informed decisions across a broad selection of stocks.