Ever wonder how it feels to follow Buffett's moves as they happen? Imagine a tool that brings you his top picks live, so you see his key trades right when they occur. It blends fresh market data with official SEC filings, so you can watch how every change in his portfolio shapes his strategy. In this guide, we’ll show you how a real-time glimpse into Buffett's investments might completely change the way you view stock watching.
Warren Buffett Portfolio Tracker: Real-Time Insights into His Top Holdings
Imagine being able to see Buffett’s portfolio up close. The Q2 2025 SEC 13F filing shows he holds 41 securities with a combined value of about $257.5 billion. This tracker gives you live market data so you never miss a beat on his latest moves.
The interactive chart updates automatically, showing you the current mix of holdings, their total value, and any recent market shifts. For example, you can watch the numbers change in real time, much like a compass adjusting its course as the market shifts.
Key benefits include:
- Real-time details that make each holding clear.
- Automatic updates based on the SEC filings to keep things accurate.
- An easy-to-use design that opens up detailed financial info to everyone, even if you’re new to tracking market data.
It’s like having a personal financial helper keeping tabs on Buffett’s portfolio for you. By combining his official SEC filings with live market data, the tracker offers a smooth and engaging experience, removing the need for constant manual checks.
This dashboard turns static filings into a dynamic view of top investments, making it simple to follow market trends as they happen. Have you ever felt the thrill of watching your favorite investor’s strategy unfold in real time?
Warren Buffett Portfolio Tracker: Stellar Stock Insights
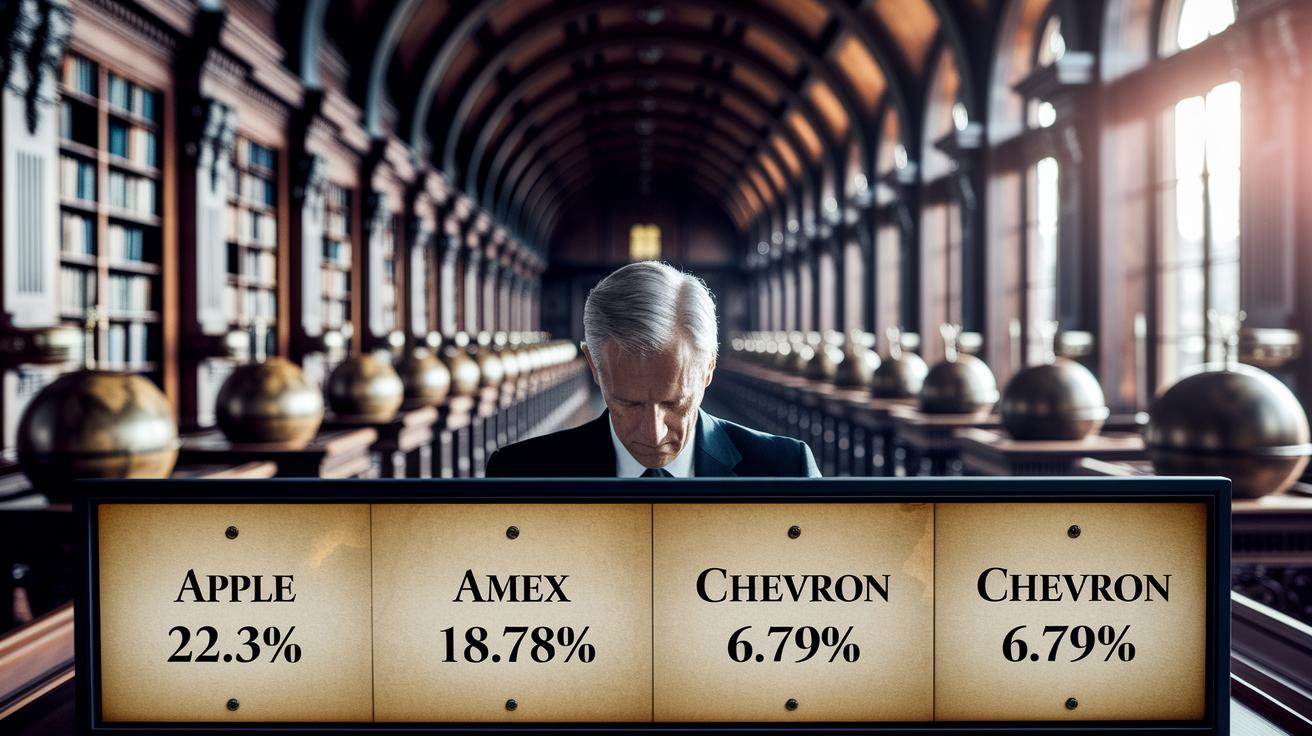
Warren Buffett’s portfolio tracker puts his favorite stocks in plain view. As of June 30, 2025, you can see his key holdings like Apple Inc. at 22.31%, American Express Co. at 18.78%, Bank of America Corp at 11.12%, Coca-Cola Co. at 10.99%, and Chevron Corp at 6.79%. These numbers show you exactly where most of the money is parked, making it easy to see which stocks drive the portfolio.
The tracker uses an interactive table that breaks down each holding by its share of the portfolio and even includes a spot for its estimated market value. It works a bit like your favorite portfolio analysis tool, giving you a clear snapshot of each major stock. Imagine looking at a table row where Apple Inc. shows 22.31% weight with its real-time market value updated as you check.
| Company | Portfolio Weight | Est. Market Value |
|---|---|---|
| Apple Inc. | 22.31% | $X billion |
| American Express Co. | 18.78% | $X billion |
| Bank of America Corp | 11.12% | $X billion |
| Coca-Cola Co. | 10.99% | $X billion |
| Chevron Corp | 6.79% | $X billion |
This setup lets you instantly see how much weight each stock holds in the overall portfolio. Plus, the dynamic features let you drill down into each position as the market shifts. It’s like having a friendly guide to help you navigate the steady pulse of the market.
Historical Performance Tracking in a Warren Buffett Portfolio Tracker
Since 2013 and up until August 2025, Buffett’s portfolio clocked an annual return of about 10.87%, while the S&P 500 hit around 12.03%. Tracking these trends offers you a clear picture of how his targeted strategy unfolds over the years. Imagine this: in just ten years, his portfolio ballooned by over $266 billion. That’s the power of disciplined, steady investing.
The tool also breaks down dividend yields. Out of 39 stocks, 29 pay dividends, generating nearly $4.8 billion in yearly income with a yield on cost of 3.25%. This clear presentation lets you easily compare Buffett’s performance with broader market benchmarks and his own set goals.
You can also explore an interactive dashboard where graphs and charts update with fresh data, turning long-term performance into an engaging narrative of value creation. As you review annual returns and dividend gains, you get a taste of value investing, a strategy that takes patience and smart choices.
This all-in-one historical view serves as a real-time snapshot of how one of the world’s top investors has built his wealth, helping you make sense of the journey with transparency and insight.
Monitoring Buffett’s Portfolio Changes with Live Investment Alerts in a Warren Buffett Portfolio Tracker

This tracker gives you a clear, up-close look at what Buffett is doing by pulling real-time details from his latest 13F filings. It captures every buy and sell, even showing sold shares and adjusting for splits. Have you ever seen an alert like, "Buffett sold shares of Company X"? That’s the kind of timely update you get, straight from his latest filing.
You can set up email tips or in-app alerts so you never miss any change, big or small, in his portfolio. It’s all about making sure you know when something important happens, and you can even choose to follow only the updates that catch your eye.
Here are some simple features to enjoy:
| Feature | Description |
|---|---|
| Daily Updates | Every single trade is tracked, so you stay informed. |
| Instant Notifications | Get alerts on key details like split-adjusted values right when they happen. |
| Email & In-App Alerts | Simple settings that keep you updated even when you’re on the move. |
If you’re ready to dive a little deeper, exploring advanced options like quantitative portfolio management might be the next step. It turns complex market data into friendly, live updates, making it easy to follow Buffett’s every move.
Comparing Investment Tracking Software for a Warren Buffett Portfolio Tracker
When you're watching your investments, you want a tool that makes everything clear. The best platforms offer friendly dashboards that update in real time, fun graphs you can add to your own pages, and history views that let you explore every part of your portfolio.
They turn long lists of numbers into bright, easy-to-read charts. These visuals help you catch important trends without the headache of crunching raw data.
| Feature | What It Does |
|---|---|
| Interactive Dashboards | Show real-time numbers with smooth updates |
| Embeddable Charts | Display portfolio breakdowns and cost basis details |
| Downloadable Reports | Export your data as CSV or PDF to review later |
| Dividend Yield Summaries | Spot income-generating stocks and compare them to market trends |
Think of choosing one of these tracking tools like picking the perfect car for a fun road trip. Some give you lots of ways to personalize your view, while others keep everything simple and easy to use.
Since each option comes with its own price tag and quality of data, it pays to look closely at what fits your needs best. Many of these tools even come with built-in financial analysis features that share clear, step-by-step trade insights.
Step into a modern way of tracking Buffett’s portfolio and feel like you’re right in the middle of all the market action.
Integrating Buffett’s Market Valuation Metrics in Your Warren Buffett Portfolio Tracker

Buffett’s approach is all about backing companies that deliver steady cash flows, so getting a handle on market valuation numbers is really important. A good portfolio tracker goes beyond just showing stock prices; it helps you see key figures like the P/E ratio, which tells you if a stock is overvalued compared to its earnings. Dividend yields show the cash you might earn from your investment, and yield on cost compares your current returns to what you initially paid. Plus, a feature that tracks your estimated cost basis lets you clearly see how your investment has performed over time.
Imagine a dashboard widget that updates in real time, displaying the current dividend yield next to its historical averages, like keeping an eye on your portfolio’s heartbeat. You can even set up custom alerts to let you know when these figures stray from normal levels, offering a constant stream of insights, much like the ones Buffett is famous for.
Some handy features you might add include:
| Feature | Description |
|---|---|
| P/E Ratio Monitor | Shows real-time price-to-earnings figures to help you gauge stock value |
| Dividend Yield Tracker | Displays both current and past dividend yields so you can track income trends |
| Cost Basis Comparison | Compares what you paid initially with today’s market value to measure performance |
This setup turns raw numbers into clear signals, letting you track and evaluate your investments with confidence. Ever felt the thrill when everything lines up just right? That’s the kind of steady, informed insight which makes smart investing feel both accessible and empowering.
Historical Allocation Changes and Cost Basis in a Warren Buffett Portfolio Tracker
The tracker offers a clear view of stock portfolio evolution by mapping sector shifts and position changes over time. Using an interactive chart timeline, users can see how weightings have moved, highlighting periods of concentrated holdings and diversification. For example, imagine a timeline where the tech sector sees a gradual rise from 15% to 23%, it gives you a tangible picture of the portfolio’s evolution.
Users benefit from estimated cost basis methods that let them compare the purchase price to today’s market value. This approach simplifies the study of portfolio composition, making it easy to understand how initial investment decisions translate into current performance. One might observe a scenario like: "Bought at $100, now valued at $150, what a clear mark of growth!"
Key elements include:
- Reviewing allocation trends: Follow the shifting contributions of various sectors.
- Tracking cost basis details: Compare original buy prices with current market values.
- Studying turnover insights: See when rebalancing efforts led to significant changes.
| Feature | Description |
|---|---|
| Sector Changes | Observes shifts in industry weightings over selected periods |
| Cost Basis Tracking | Compares acquisition costs to current market values |
| Turnover Rates | Highlights adjustments in portfolio positions |
Final Words
In the action, we've explored how the warren buffett portfolio tracker brings live insights into Buffett’s top holdings. The post highlighted real-time charts, detailed breakdowns of major positions, and dynamic alerts on portfolio changes. We touched on historical performance and cost basis trends, offering a clear look at Buffett's investment style. This overview makes smart investing feel accessible and actionable. It's inspiring to see how real-time data empowers you to stay ahead with confidence.
FAQ
What does the Warren Buffett portfolio list include?
The Warren Buffett portfolio list shows his current SEC 13F filings, presenting updated holdings, overall portfolio value, and market data to help you see which companies he is invested in.
What can I expect from the Warren Buffett portfolio 2025 tracker?
The Warren Buffett portfolio 2025 tracker delivers real-time updates from Q2 filings, displaying a detailed view of 41 security holdings valued at $257.5 billion with interactive charts and live market data.
What do Warren Buffett recent buys and his current stock selections reveal?
Warren Buffett recent buys and current stock selections are tracked as part of SEC filings, offering detailed lists of trades, including buy and sell activities, so you stay informed about his evolving strategy.
What are Berkshire Hathaway top holdings?
Berkshire Hathaway top holdings include key positions like Apple Inc., American Express, Bank of America, Coca-Cola, and Chevron, each with their respective portfolio weights clearly outlined for easy review.
What are Warren Buffett stock picks for beginners?
Warren Buffett stock picks for beginners focus on companies known for steady dividends and strong cash flow, providing a practical starting point for new investors learning to build a resilient portfolio.
What is the 70/30 Buffett rule investing?
The 70/30 Buffett rule investing suggests allocating roughly 70% to core, dependable stocks while keeping 30% available for potential opportunities, balancing stability with growth in your overall strategy.
What is Warren Buffett’s 90/10 rule?
Warren Buffett’s 90/10 rule recommends that most investors consider placing about 90% of their funds in low-cost index funds for broad exposure, while dedicating around 10% to select individual stocks or opportunities.
What is Warren Buffett’s #1 rule?
Warren Buffett’s #1 rule is to avoid losing money by focusing on high-quality companies with solid fundamentals, reinforcing the idea that preserving capital is as important as achieving gains.