
Have you ever wondered if your portfolio tracker really gives you the whole story? These tools update as the market moves, offering fast alerts and live data so you can make clever moves. But can you trust every update to show exactly how your investments are really doing?
Here, we'll dig into how these trackers work and explore what all those numbers truly mean for your portfolio. That way, you can decide if the tool is as spot-on as it appears.
Portfolio Tracker Accuracy: Essential Metrics and Overview
Portfolio tracker accuracy tells you how well a tool shows your real investment results. Real-time updates mean you get live market data and alerts that help you act fast. For instance, if you get a message saying "Stock X dropped 5% in less than a minute," you'll know the system is working to keep you in the know.
Key numbers like price updates, volume changes, and how quickly an asset can turn into cash (liquidity) are essential. Trackers pull data from all your accounts and display it on one easy-to-read dashboard. This setup makes it simple to see your asset spread and catch any sudden market moves. Imagine getting a timely alert when the market unexpectedly dips, it's all thanks to the system watching changes like growth shifts and market mood variations.
The accuracy of these trackers depends on instant market updates that let you react quickly. With up-to-date insights, you can adjust your investments by moving funds around or setting personal goals to manage unexpected risks. A quick move based on fresh data might help you seize a short-term chance or reduce losses.
The main measures for judging tracking accuracy include digital performance stats, live analytics, and built-in market alerts. By focusing on high-quality data, every update and alert gives you a more reliable snapshot of your portfolio's performance.
Here's an interesting fact: before reliable portfolio trackers, investors often missed fast market swings, leaving them unprepared for sudden price changes. Now, this technology helps smooth out those bumps.
Evaluating Data Reliability in Portfolio Trackers

Portfolio trackers rely on clean, secure data to help you make smart investment choices. It’s important for investors to check that the numbers in their tools are both accurate and safe. One common approach is to compare the tracker’s live feed with trusted market benchmarks. This way, you know the stock prices and asset values are updated correctly and reflect real market conditions.
Integration tests take this a step further by making sure all parts of the software work well together and keep your sensitive financial details secure. Trusted data aggregators provide secure, read-only access, which is a key piece of the puzzle. Investors can feel confident when they know that the tracker is pulling in data that’s both correct and safe. Regular system log reviews and automated checks help catch any errors early, such as delays or mismatched information.
All these steps build trust in your portfolio tracker, ensuring you can depend on it for clear, secure, and reliable information to guide your financial decisions.
Statistical Performance Measures for Investment Tracker Precision
When you look at your portfolio tracker, you see numbers that show how your investments are doing. The tool keeps an eye on important figures like revenue, profit, cash flow, and customer growth. These metrics paint a clear picture of how a company evolves over time.
Take profit, for example. You might notice the net margin shifting from one quarter to the next. Early investors even discovered that small changes in cash flow margins could hint at big shifts in a company’s cost management practices.
Quality checks are equally important. These systematic tests make sure the data matches real market conditions. Another key measure is Return on Assets (ROA), which tells you how well a company uses its assets to earn profit. Think of it like checking if a car is using its fuel efficiently. When the numbers all line up, the tracker is on the right path.
Tracking these numbers starts from the day you acquire shares. This careful recording helps investors decide when to buy, sell, or hold their stocks. Automated quality checks and regular comparisons with industry benchmarks ensure that the tracker’s results are a reliable look at a company's financial health.
Benchmark Accuracy Standards and Comparative Scoring Models in Tracker Evaluation

Portfolio trackers lean on solid benchmarks to check key figures like revenue, profit, and cash flow (that’s the cash coming in and out). They also use scoring models to compare your portfolio’s numbers with industry standards. Imagine a system that gives a company an 85 out of 100 for cash flow growth against its peers, it shows the company is running efficiently.
Investors use these comparisons to see if their numbers match market expectations. Sometimes, a tracker might tell you that your portfolio isn’t hitting the benchmark, prompting you to take a closer look at each stock. It’s like a built-in scorecard that helps you manage risks and make better choices.
A typical evaluation framework works like this:
- It compares your digital performance stats with external scores.
- It uses a points system to mark revenue and profit milestones.
- It runs regular checks to ensure the numbers match global trends.
These benchmarks and scoring models give you a straightforward way to double-check data accuracy. When a tracker’s algorithm spots an odd profit figure and flags it, it’s following a set process that keeps your investment overview clear and trustworthy.
Common Discrepancies and Algorithmic Review in Portfolio Tracking
Portfolio trackers are great for showing you real-time updates, so you can act on the market quickly. But, do keep in mind that even these handy tools can have hiccups. You might notice delayed updates, mix-ups with currency rates (that’s when one currency’s value doesn’t match up correctly with another), or even sudden API outages. Imagine checking your account and seeing a stock price that hasn’t updated for a few seconds, sometimes, even a small pause can affect your decisions.
To help catch these issues early, algorithm performance audits come into play. Basically, these audits mean running a set of checks that compare what your tracker shows with trusted financial information. Think of it like an automated watchdog, special scripts that alert you if there’s an unexpected 10% drop in a stock’s value. When that happens, you know it’s time for a closer look to see if it’s a real market change or just a silly glitch.
Here’s how it usually works:
| Step | What Happens |
|---|---|
| 1 | Live data is compared with trusted benchmarks. |
| 2 | System logs are checked for any update delays. |
| 3 | Currency conversion rates are reviewed for consistency. |
Developers set clear criteria for these reviews. They include acceptable delays in data updates and specific accuracy levels for how currencies convert. Plus, robust security measures make sure that your sensitive data stays safe, even though no system can catch every tiny error.
By blending systematic audits with focused reviews, portfolio trackers aim to give you a close match to real-time market activity. It’s all about making sure you have the best, most trustworthy information when you’re making your investment moves.
Comparative Analysis of Top Portfolio Tracking Tools
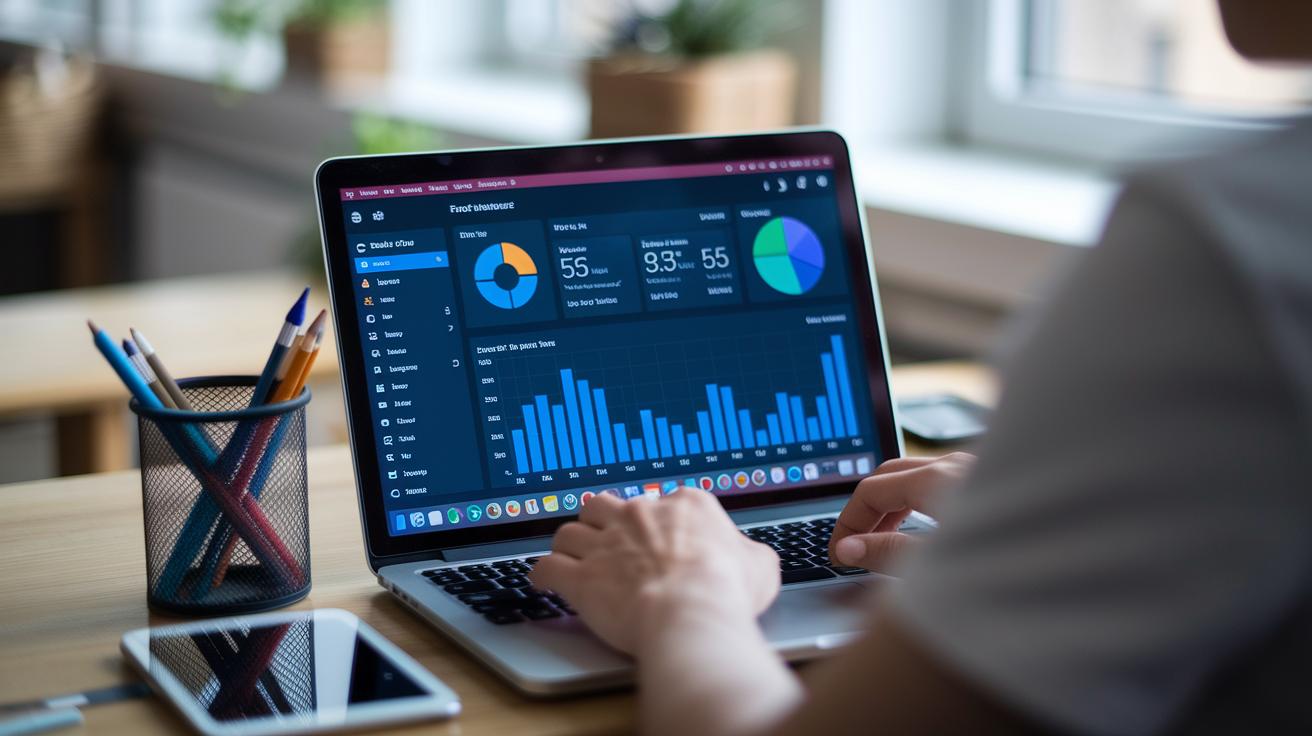
When you’re choosing a portfolio tracker, it helps to look at how well each tool performs and how easy they are to use. One popular tool really shines with its all-in-one dashboard that lets you view all your accounts safely. It pulls data from different financial sources without ever letting anyone change what’s really happening with your money.
Most of these tools are made to keep things simple. They have clear designs that even a busy investor can quickly get. For instance, you might see one tool that breaks down your numbers with easy-to-read graphs and color alerts. Another might keep things neat and minimal, so spotting trends feels like looking at a clear map of market activity.
Reliability is another big deal. Some trackers check themselves every day to make sure that things like price moves and digital performance numbers are correct. Others even use helpful AI tips which watch the market live and give ideas when an asset starts acting differently. Imagine getting a friendly heads-up when your investment shifts, this kind of real-time nudge can really support both short-term moves and long-term strategy.
Speed of updates matters a lot too. The best tools refresh almost instantly so you see nearly live numbers. Keeping an eye on these quick updates means you can tell if your portfolio is on track toward its goals. While one tracker might refresh every few seconds, another might have a tiny delay that could affect how quickly you react to a sudden market change.
| Feature | Platform A | Platform B |
|---|---|---|
| Interface Design | User-friendly with bright, color alerts | Minimalist approach with a focus on data |
| Data Integrity | Regular daily audits and secure access | Real-time sync with built-in AI checks |
| Update Frequency | Instant, live updates | Slight lag in some sections |
If you’re curious to dive deeper, you might want to explore tools that offer even more detailed market analysis. Have you ever felt the reassurance of knowing your financial info updates in real time? That kind of immediate feedback can give you the confidence to navigate the market with a bit more ease.
how accurate are portfolio trackers: evaluating performance!
Manual checks can catch tiny mistakes that computers might miss. For example, one investor compared his tracker’s closing number with his broker’s statement and found a small misalignment. He said, "I compared my tracker's end-of-day value with my broker's report and spotted a minor error that made me look over other key holdings."
This hands-on method goes beyond everyday checks and automated log reviews. Instead, it focuses on stocks that trade in high volumes or behave wildly, especially during volatile days. In one case, manually reviewing key stock positions during sudden market shifts uncovered errors that the automatic audits had skipped.
- Intensive manual reviews on busy stocks help pinpoint slight differences
- Case comparisons, like matching a closing number with a broker's statement on wild days
- Dedicated sessions during market swings to increase trust in your tracker
Regular hands-on reviews work together with automated methods to keep your portfolio tracker accurate over time.
Final Words
In the action, we explored portfolio tracker accuracy, diving into real-time monitoring, data reliability tests, and precise performance measures. We also broke down how benchmarks and scoring models help verify results while keeping discrepancies in check.
Our review shed light on validation techniques that secure your financial insights, empowering smart decisions daily. Remember, how accurate are portfolio trackers: evaluating performance means combining solid data with timely checks. Keep an eye on these metrics, and you’ll feel more confident managing risk and staying ahead of trends.
FAQ
How accurate are portfolio trackers evaluating performance?
The portfolio trackers’ accuracy is measured using real-time data, statistical metrics, and benchmark comparisons. Feedback from Reddit and reviews in 2022 suggest accuracy depends on data integrity and update frequency.
What do portfolio performance evaluation documents (PDF/PPT) include?
Portfolio performance evaluation documents typically include tracking methods, statistical measures, and key performance indicators. They outline how results compare with benchmarks to support smarter investment decisions.
What does portfolio performance mean?
Portfolio performance means tracking the overall gains or losses of your investments over time. It shows how profit, cash flow, and overall returns stack up against expected benchmarks.
What are portfolio performance evaluation methods?
Portfolio performance evaluation methods involve using statistical metrics, benchmark comparisons, and quality reviews to track indicators such as revenue and profit growth. These methods help inform buy, sell, or hold decisions.
What is the best measure of portfolio performance?
The best measure combines return figures with risk assessments using factors like net margin and cash flow margins. This comprehensive view captures both profitability and market volatility.
What is the 5% portfolio rule?
The 5% portfolio rule recommends putting no more than 5% of your total assets into a single investment, helping spread risk across different holdings.
What is the 70 30 rule in investing?
The 70 30 rule in investing means allocating 70% of your portfolio to lower-risk assets and 30% to higher-risk opportunities, balancing stability with potential growth.
How do you evaluate the performance of a portfolio?
Evaluating portfolio performance involves reviewing statistical metrics, real-time data feeds, and benchmark comparisons, along with quality checks and periodic reconciliation against brokerage statements.