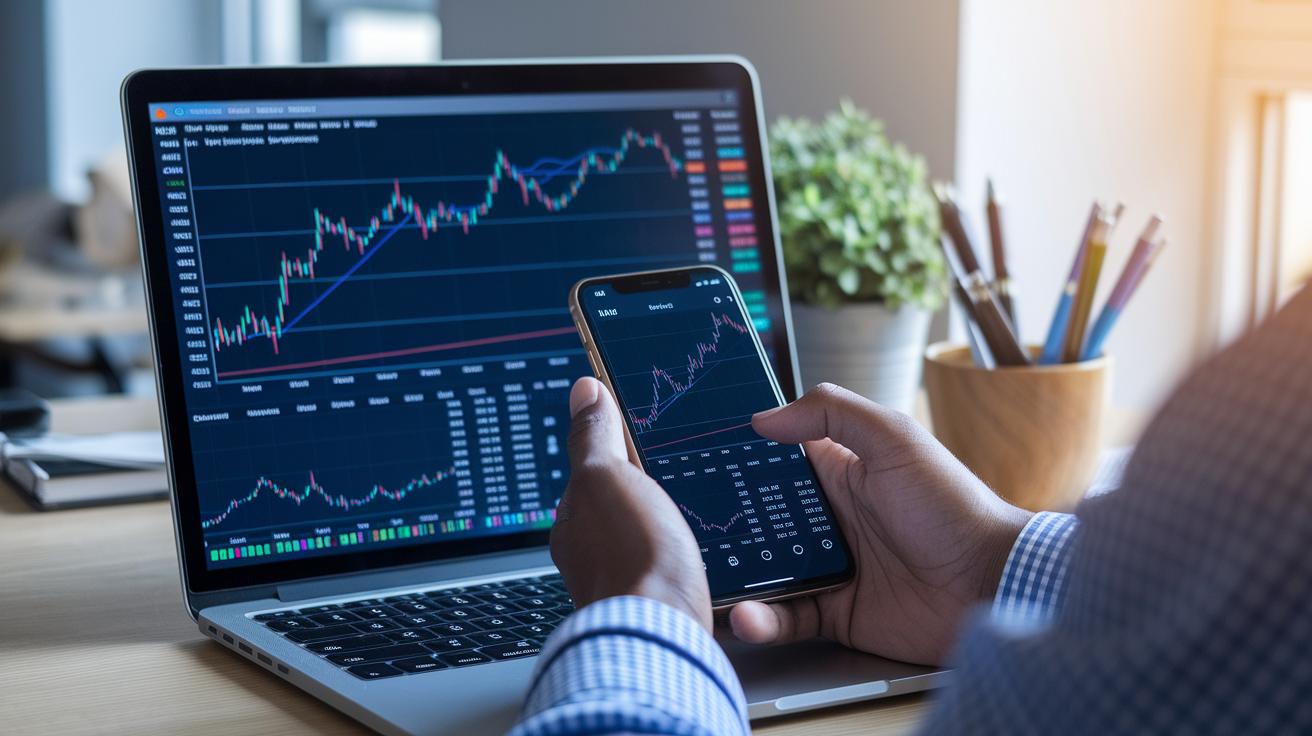
Have you ever gotten frustrated by clunky charting apps when you need fast answers? Mobile charting software is turning that around. It brings real-time data and clear visuals straight to your phone.
Imagine using platforms like TradeVision or TradingView that help you make snap decisions with confidence. Even if you’re new to trading or a seasoned pro, these tools can boost your strategy and keep you a step ahead.
This post is here to show you how a smart mobile app can give you quick market insights on the move. Stick with us and see how you can navigate the market with ease.
Mobile Charting Software: Quick Overview for Traders
When you're trading on the move, having the right mobile charting tool can really make a difference. TradeVision, TradingView, ThinkorSwim, Stocktwits, and Robinhood each bring something unique to the table as of August 18, 2025. These apps combine real-time market feeds with solid charting tools so you can get a clear view of the market quickly.
TradeVision stands out with its easy-to-use design and live data feeds. TradingView offers a rich set of technical analysis tools, including a huge library of drawing aids and community-built indicators. Each tool caters to different types of traders. Whether you’re a seasoned professional or just starting out, these apps cover your needs. For example, Robinhood’s simple layout makes it great for beginners, while ThinkorSwim has all the in-depth, streaming data professionals rely on.
| App Name | Key Strength | Best Use Case | Platform Availability |
|---|---|---|---|
| TradeVision | Real-time market feeds & intuitive UI | Thorough mobile stock analysis | iOS, Android, Web |
| TradingView | Highly customizable technical analysis | Detailed charting for active traders | iOS, Android, Web |
| ThinkorSwim | Advanced technical charting and analysis | Professional-grade data analysis | Desktop, Web, Mobile |
| Stocktwits | Instant idea sharing with live feeds | Social trading with clear overlays | iOS, Android |
| Robinhood | User-friendly charts for beginners | Simple interface for new traders | iOS, Android |
These mobile platforms mix speed with customization in a really user-friendly way. You can adjust quickly, whether you're looking at detailed chart overlays or tracking price updates in real time. And with each app offering its own set of benefits, you can pick the one that fits your trading style, risk comfort, and overall goals.
Isn’t it great to have a tool that helps you see the market’s pulse anytime and anywhere? With these options, you get a flexible, agile trading dashboard that makes on-the-go trade visualization both accessible and effective.
mobile charting software for traders: Swift Market Clarity
Mobile charting apps bring a strong technical analysis toolkit right into your pocket. It’s like carrying a mini trading desk wherever you go. These apps let you add custom indicators, run detailed studies, and even use smart AI to pick out trendlines so you can catch market shifts as they happen.
- Extensive Indicator Library: Imagine over 100,000 user-made indicators at your disposal to cover nearly every type of market analysis.
- Customizable Chart Overlays: You can tweak your visual displays with a variety of drawing tools, making your charts feel just right.
- Advanced Technical Studies: With over 400 in-depth studies, you get a closer look at the market’s pulse.
- Real-time Scanning and Alerts: Get notified instantly when key price changes occur.
- AI-Driven Trendline Detection: This feature automates multi-timeframe analysis, offering you sharper insights.
- Fundamental Charting Templates: Combine technical views with market fundamentals using ETF valuation overlays.
- Custom Scripts and Saveable Watchlists: Personalize your analysis and quickly refer back using tools like thinkScript.
Together, these features deliver clear market insights whether you’re a day trader or a long-term strategist. With such a flexible and powerful toolset at your fingertips, turning complex data into actionable insights becomes refreshingly simple. Isn’t it exciting to see advanced tech combined with easy customization, letting every trader shape their own analysis experience?
Real-Time Data & Analytics in Trader Mobile Charting Apps
TradeVision and ThinkorSwim give you live, minute-by-minute updates of price and volume data. This means your mobile device stays in sync with the market's heartbeat every moment. The cloud-based analysis feels smooth and keeps you in touch with even the slightest market moves.
TradingView lets you watch real-time exchange feeds with hardly any delay, so you see trade data as it happens. And then there’s TrendSpider, its server-side scans send instant alerts and monitor multiple symbols at once. This mix of remote trade data and cloud analysis offers clear, visual insights that you can take with you wherever you go.
Yahoo Finance shows real-time quotes and simple charting, but it might not have all the detailed tools an active trader wants. On the other hand, Finchat uses basic charts and delays its price updates by one day, which can be a problem when you need immediate data. In truth, these options remind us how important it is to choose a tool that fits your need for quick, clear market analysis.
mobile charting software for traders: Swift Market Clarity
TradeVision brings a fresh mobile design that makes switching from dark to light mode a breeze. You can easily adjust your workspace to match how you trade, so every button and chart is where you need it. This clear layout helps keep distractions low and your focus right on the market.
TradingView makes things simple across iOS, Android, and even web browsers. Your chart layouts and watchlists sync up perfectly, meaning you start on your phone and continue on your tablet without missing any details. The smooth, steady navigation gives you the confidence to switch devices while keeping track of every market move.
ThinkorSwim combines desktop, web, and mobile tools into one solid package that packs deep technical insights. Sure, its mobile setup might feel a bit trickier at first, but once you get it, you have a powerhouse of data. On the flip side, StockCharts offers mobile-friendly charts that clearly show the critical numbers, making it easy for any trading style to stay informed.
Security & Data Protection in Mobile Charting Software for Traders
When you're trading on the go, keeping your data safe really matters. Mobile charting apps use strong methods to lock down your information. They send your data securely with TLS or SSL and store it safely with AES-256. This means your sensitive trade details are well guarded while you focus on the market.
Most platforms also beef up your login security. You can often unlock your account using your fingerprint or Face ID, and many services add an extra step with two-factor authentication, either through a text message or an authenticator app. This extra care helps keep any unwanted visitors out without making it hard for you to log in.
Plus, these apps automatically back up your settings and watchlists in the cloud. Thanks to encrypted backups, your custom charts and indicators travel safely from one device to another. In short, your mobile charting data stays protected every step of the way.
Pricing & Subscription Models for Mobile Charting Software for Traders

Below you'll find a straightforward look at various pricing plans for mobile charting tools. We’ve put together key details to help you choose a service that fits your budget and trading needs. Did you know that TradingView even lets you use basic charts for free? Upgrade, though, and you unlock a vast library of tools for sharper visuals.
| Platform | Free Tier | Paid Plans | Value Note |
|---|---|---|---|
| TradingView | Basic charts | $14.95/mo to $59.95/mo | Large indicator library and customization |
| TrendSpider | N/A | $33–$67+/mo | Automated multi-timeframe analysis |
| ThinkorSwim | Free via TD Ameritrade | N/A | Professional-level analytics |
| TIKR | N/A | Low-cost subscription | Essential research with basic charting |
| StockCharts | Free basic plan | Starts at $14.95/mo | Advanced indicators for detailed analysis |
Pick a plan that matches both your wallet and your trading style, and you'll have a tool that helps you see market trends clearly without repeating features you already know about.
How to Choose the Best Mobile Charting Software for Your Trading Needs
When you’re looking for a mobile charting tool, think of it like picking a good friend who understands your trading style. You want something that gives you real-time market hints, keeps your information safe, and isn’t too complicated to use. It’s about finding that sweet spot between speed, useful features, and cost that helps you make smarter trades wherever you are.
Here are a few tips to keep in mind:
• Check that the cost makes sense for the fast, up-to-date data you need.
• Look at features like drawing tools, technical indicators (tools that help you see trends and potential price moves), and scanners. Make sure they match your style, whether you trade a lot in one day or hold on for a bit longer.
• Confirm the security side is solid. That means strong encryption, ways to log in with your fingerprint or face, and an extra layer of protection like two-factor authentication.
• Pick a tool with an easy, friendly design that works smoothly on different devices, even letting you peek at charts when you’re offline.
• See if it can connect directly to your broker so that placing trades is as seamless as chatting with a friend.
By keeping these points in mind, you’ll be able to find a mobile charting software that really clicks with your trading needs, making each chart and alert feel like the perfect part of your trading journey.
Final Words
In the action of exploring market tools, we reviewed top mobile solutions, covering everything from real-time data updates to user-friendly interfaces and robust security features. We broke down key technical aspects, pricing models, and decision criteria so traders can manage risk and seize opportunities confidently.
Every section offered clear insights into features that truly matter in fast-paced trading. Mobile charting software for traders equips you with the practical tools needed for smart investment decisions. Keep moving forward and trust your strategy.
FAQ
What mobile charting software do traders recommend on platforms like Reddit?
Mobile charting software recommended by traders on platforms like Reddit usually includes both free and premium options. TradeVision and TradingView are popular for their real-time feeds, simple interfaces, and robust technical analysis features.
What are the best charting software options for day trading and mobile use?
Best charting software for day trading and mobile use delivers fast updates, clear charts, and versatile tools. Apps like TradeVision, TradingView, and TC2000 offer streamlined interfaces and advanced features well suited for active trading.
What charts do traders use?
Traders use charts such as candlestick, bar, and line charts. These visual tools help assess market trends, volumes, and price movements, enabling quick decisions based on clear, real-time data.
What is the 7% rule in stock trading?
The 7% rule in stock trading means targeting a 7% gain on trades or placing stop-loss orders 7% below the purchase price. This approach helps manage risk while aiming for reasonable profits.
What is the best mobile trading platform?
The best mobile trading platforms provide real-time data, ease of navigation, and strong security measures. Many traders favor systems like TradeVision and ThinkorSwim because they balance advanced tools with user-friendly designs.
What is TC2000 charting?
TC2000 charting is a well-known software offering advanced technical analysis tools and customizable charts. It helps traders visualize market data clearly, making it a reliable tool for detailed stock analysis.